
中文版
Imagine you walk into a fruit stand, and the owner proudly announces: "I have a 'fruit gift basket' with 100 types of fruit!" That sounds wonderfully diverse, doesn't it? But when you peek inside, you find 70 apples, 20 bananas, 5 oranges, and only 5 other fruits. Suddenly, that "100 types of fruit" basket isn't so diverse after all; it's heavily concentrated in just a few items.
ETF concentration works in precisely the same way.
ETFs, or Exchange-Traded Funds, were designed to help investors diversify investment risk by providing a "basket of stocks." However, if the majority of that basket's capital is allocated to just a handful of prominent tech stocks, it mirrors our "fake diverse" fruit basket. It appears diversified on the surface but is, in reality, highly concentrated. This hidden concentration introduces significant risk.
Three Key Metrics to Understand Concentration Risk
To truly assess the underlying risk in your ETF investments, pay close attention to these three critical metrics:
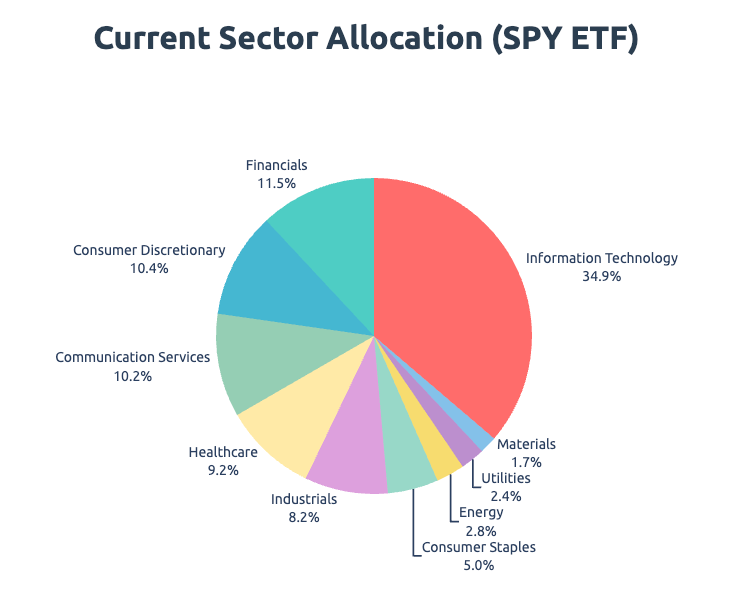
1. Tech Stock Allocation This metric measures the percentage of your ETF's total investment that is dedicated to technology companies.
- If over 45% of your fund is invested in tech stocks (like
Apple,Microsoft,Nvidia), your portfolio is likely too concentrated. - Think of it as putting nearly half of your life savings into
Applestock. IfAppleexperiences a downturn, your entire portfolio could suffer a significant blow.
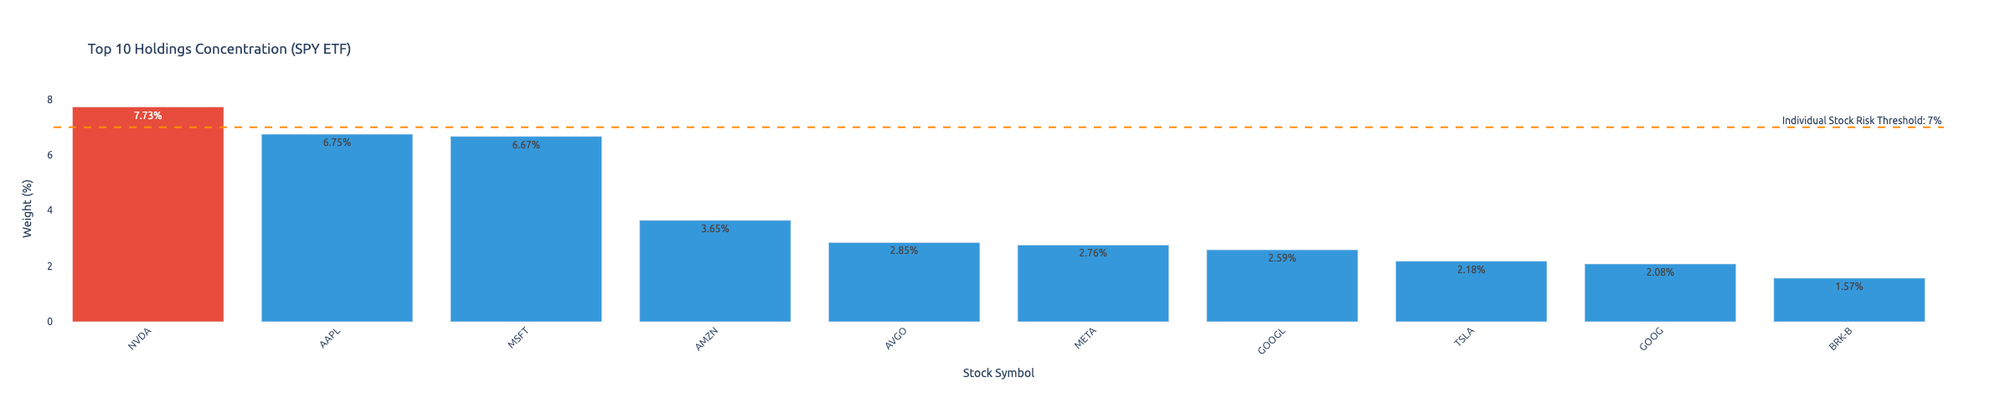
2. Top 5 Holdings Percentage This reveals how much of your total investment is represented by just your top five individual stock holdings within the ETF.
- If your top 5 stocks account for more than 28% of the ETF's value, the concentration risk is considered very high.
- This is akin to linking all your primary financial tools—your payroll card, credit card, and digital wallets like
AlipayorWeChat Pay—to the same single bank account. Should that bank encounter problems, your entire financial life could be severely disrupted.
3. Defensive Stock Allocation Defensive stocks are companies whose products and services are essential "regardless of economic conditions." They tend to be more stable during market downturns. Examples include:
- Utility companies: People always need electricity, water, and gas.
- Food companies: Basic food consumption remains constant.
- Consumer staples companies: Products like shampoo, toothpaste, and household cleaners are always in demand.
- If these "survival stocks" make up less than 6% of your ETF, you have virtually no "safe haven" when the broader market experiences a crash.
Lessons from Historical Disasters
History provides stark warnings about the dangers of market concentration. Each major financial crisis, while unique in its triggers, shared a common thread: excessive concentration in particular sectors or assets.
2000 Dot-Com Bubble: Tech Stocks' Collective Jump
The turn of the millennium saw an unprecedented surge in technology stocks, fueled by speculative fervor.
The Situation:
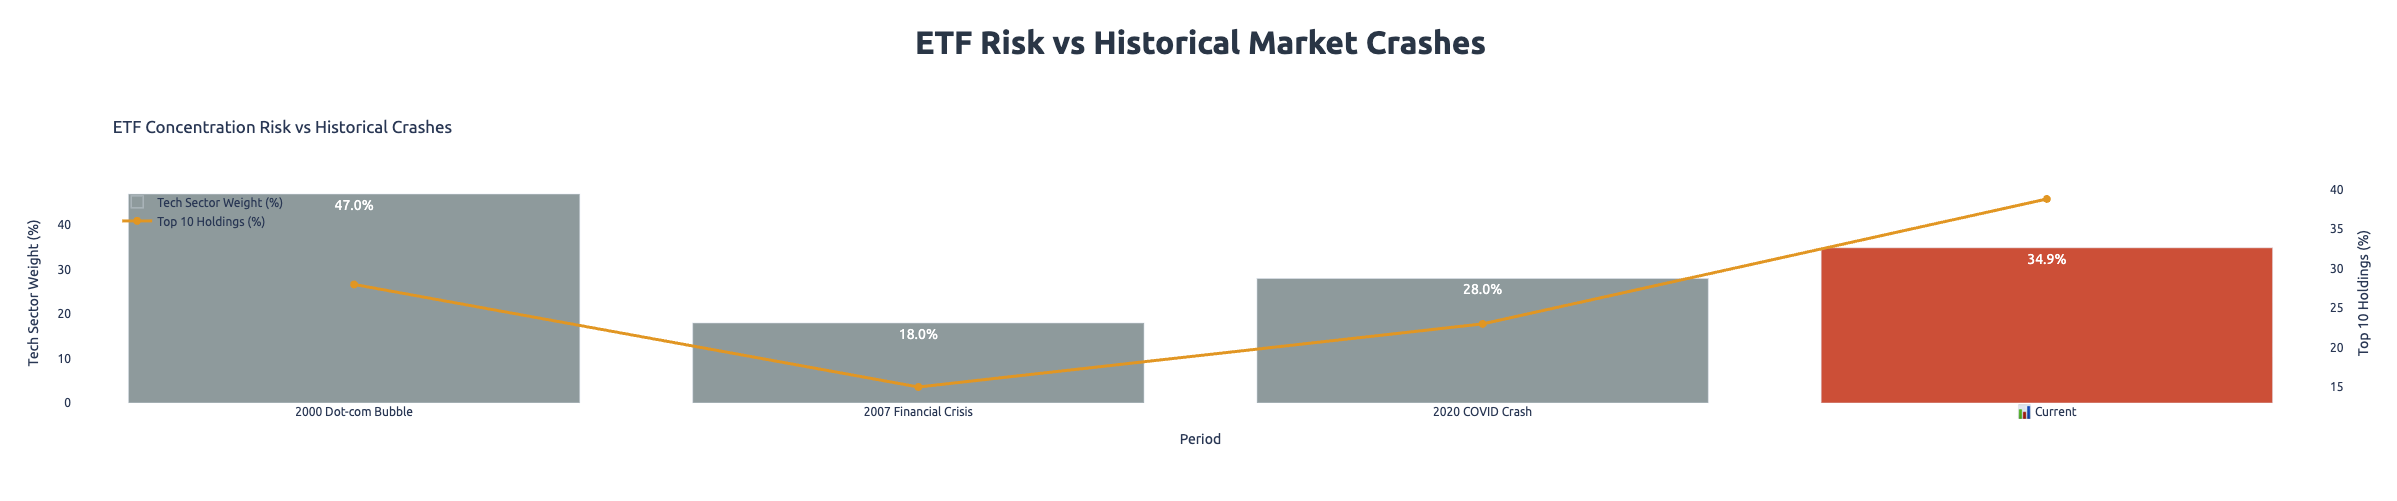
- Tech stock allocation in many portfolios approached 50%, with investors frantically buying into virtually any company with ".com" in its name.
- The top 10 companies represented over 40% of the entire market weight.
- "Defensive stocks"? Many dismissed these as "dinosaurs" and outdated investments.
The Result:
- The
Nasdaqindex plummeted from 5,000 to 1,100 points, an astonishing 78% drop. - Countless tech companies went bankrupt, wiping out investors' capital.
- Those heavily invested in tech stock ETFs faced years, sometimes a decade, to recover their losses.
Lesson: When everyone proclaims "this time is different, tech stocks will rise forever," that often signals the most dangerous period for investors. Blind enthusiasm can lead to devastating losses.
2008 Financial Crisis: Financial Stocks' Domino Effect
Less than a decade after the dot-com bust, the global financial system faced another catastrophic meltdown, this time rooted in the housing and banking sectors.
The Situation:
- Financial stocks held an extremely high allocation in many portfolios, with a widespread belief that banks and real estate were infallible "money printing machines."
- Top financial institutions commanded an overwhelming weight in major indices.
- Defensive assets were frequently mocked as the "coward's choice" by aggressive investors.
The Result:
- The
S&P 500index dropped by 57%. - The bankruptcy of
Lehman Brotherstriggered a widespread chain reaction, paralyzing credit markets. - ETFs heavily concentrated in these supposedly "rock-solid" financial stocks left investors devastated.
Lesson: Over-concentration in a single sector means that if that sector experiences a systemic failure, the entire portfolio is at risk of collapse.
2020 COVID Pandemic: Hidden Concerns Behind Tech Stock Dominance
The COVID-19 pandemic initially sparked a tech stock rally, but the underlying concentration carried its own set of risks that eventually materialized.
During the Pandemic:
- Tech stocks soared as the world shifted online, reinforcing the belief that "the future is the age of technology."
- The top 7 tech giants (
Apple,Microsoft,Google,Amazon,Tesla,Meta,Nvidia) collectively accounted for over 30% of theS&P 500. - Defensive stocks remained largely marginalized in investor portfolios.
What Happened Next:
- In 2022, as the
Federal Reserveaggressively raised interest rates, tech stocks collectively crashed. - The
Nasdaqindex dropped by 33%. - Investors heavily invested in tech-focused ETFs saw an entire year's worth of gains, and more, wiped out.
Lesson: The harder an asset or sector rises due to concentrated investment, the harder it can fall during a correction. High concentration often leads to especially brutal and swift market corrections.
Risk Thresholds: How Dangerous is Your Investment?
Based on extensive historical market data and experience, we can categorize market concentration into distinct risk grades:
🔴 Extreme Danger (Could Explode Anytime)
This is the most precarious level, indicating a market structure highly susceptible to severe crashes.
- Tech stock allocation > 45%
- Top 5 holdings > 28%
- Defensive stocks < 6%
Historical Example: The market environment immediately preceding the 2000 dot-com bubble burst.
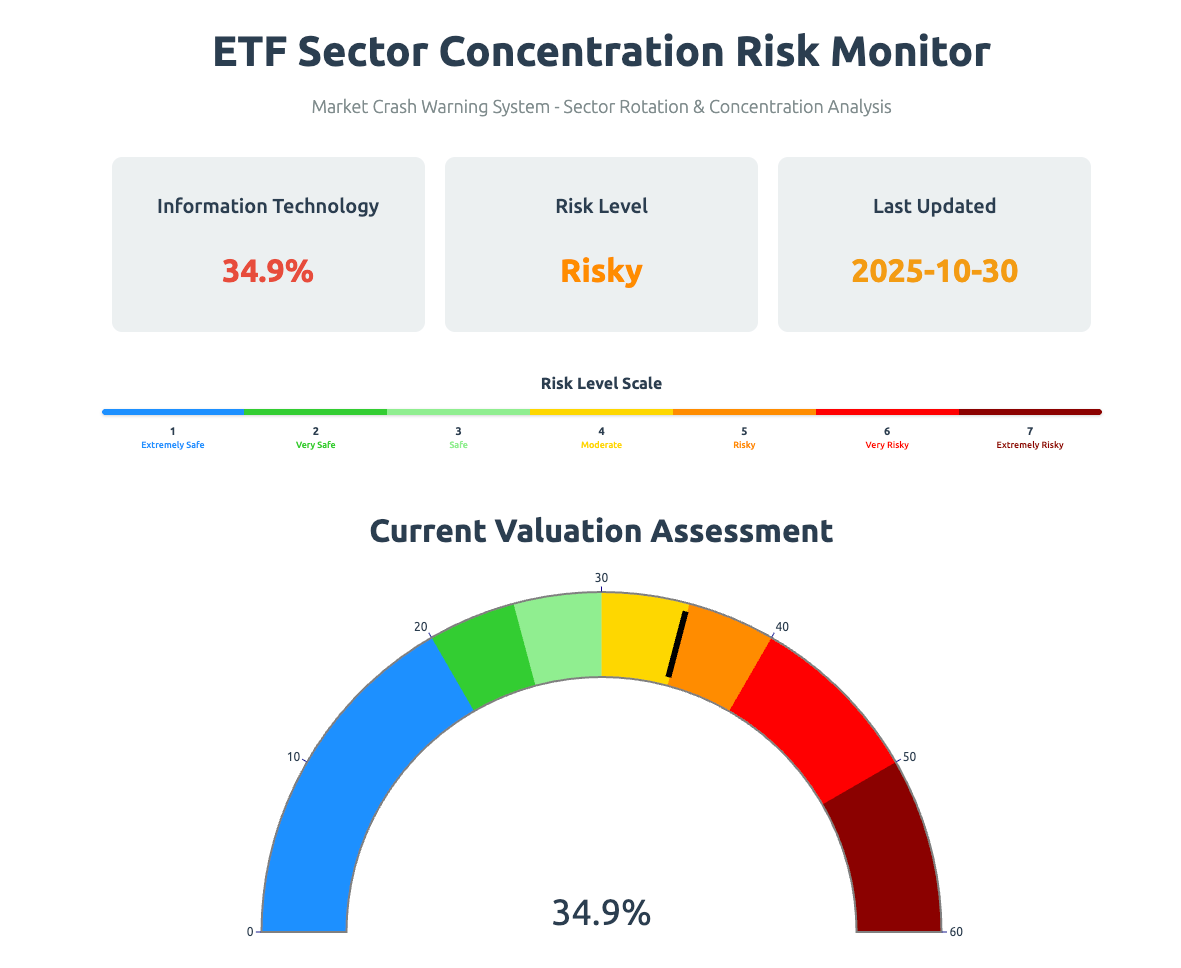
🟠 High Risk (Walking a Tightrope)
A significant level of risk where the market is vulnerable to sharp corrections.
- Tech stock allocation 35-45%
- Top 5 holdings 24-28%
- Defensive stocks < 8%
Historical Example: The period of 2020-2021 during the height of the pandemic tech stock surge.
🟡 Moderate Risk (Need to Be Cautious)
A cautionary level where warning signs exist, suggesting potential instability down the road.
- Tech stock allocation 30-35%
- Top 5 holdings 20-24%
- Defensive stocks 8-10%
Historical Example: The market situation in pre-2007, before the financial crisis intensified, where warning signs were present but not yet extreme.
🟢 Relatively Safe (Can Sleep Well)
This indicates a healthy, well-diversified market structure that is more resilient to shocks.
- Tech stock allocation < 30%
- Top 5 holdings < 20%
- Defensive stocks > 10%
Historical Example: The market conditions in the early 1990s, characterized by a relatively healthy and balanced market structure.
What Should Ordinary Investors Do?
Understanding ETF concentration is only the first step. Here's what you can do to protect your investments:
1. Regular Checkups for Your ETF
Just like a medical checkup, review your ETF holdings quarterly.
- What are the top 10 stocks? Are they diversified or concentrated?
- How much is allocated to tech stocks?
- Are there sufficient defensive stocks to provide a buffer? Early detection of concentration risks is key to prevention.
2. Don't Blindly Chase Gains
When a particular sector or asset class is experiencing exponential growth and everyone seems to be piling in, it's often the most expensive—and riskiest—time to buy. If tech stocks are going "crazy," risk is likely accumulating beneath the surface.
3. Allocate Some "Survival Assets"
Ensure you keep at least 10-15% of your investment funds in defensive stocks or high-quality bonds. Consider this your "backup parachute," providing stability when the market tumbles.
4. Diversification Isn't Buying 100 ETFs
True diversification isn't about the number of funds you own. It's about ensuring your investments are strategically spread across different industries, geographic regions, and asset types to avoid hidden correlations and excessive concentration.
Final Thoughts: History Repeats, But Never Identically
Each major market crash has its unique catalyst:
- 2000 was the bursting of the tech bubble.
- 2008 stemmed from the global financial crisis.
- 2020 was the sudden shock of a pandemic.
However, a critical commonality underlies all these events: When markets become overly concentrated in specific sectors or assets, risk accumulates to dangerous levels.
As the old investment adage wisely advises: "> Don't put all your eggs in one basket." ETF concentration analysis is your tool to determine if your investment "basket" is truly diversified enough to weather market storms.
Remember: Investing is a marathon, not a sprint. Stability and capital preservation are more crucial than chasing quick riches. Ultimately, survival in the market beats everything else.
Risk Warning: This article is for educational purposes only and does not constitute investment advice. Investment in financial markets carries inherent risk; individuals should conduct their own due diligence and consider professional financial advice before making any investment decisions. Enter the market with caution.
Data Sources:
- Federal Reserve Economic Data (FRED)
- U.S. Securities and Exchange Commission (SEC EDGAR)
- Yahoo Finance
- Historical market data analysis and research reports from various financial institutions.
