The AI Bubble Alarm: History Doesn't Repeat, But It Rhymes
The current AI boom conceals massive bubble risks. With the Buffett Indicator at 224.3%, Shiller P/E exceeding 40, and tech concentration reaching 35% - comprehensive analysis of AI bubble risk indicators and potential black swan catalysts.

中文版
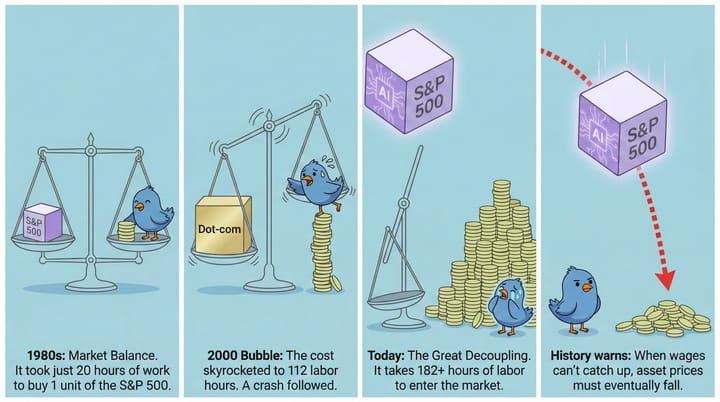
The current AI boom, while exciting, conceals massive bubble risks. With the Buffett Indicator at 224.3%, the Shiller P/E exceeding 40, and tech concentration reaching an unprecedented 35%, all indicators flash a familiar warning: "This time is different." Yet, history has a way of rhyming. This analysis will delve into the critical indicators signaling an AI bubble, explore the precarious conditions required for its continuation, and identify potential black swan catalysts that could trigger its burst.
The Numbers Don't Lie: AI Bubble Warning Signs
1. Buffett Indicator at Record High
Current Value: 224.3% (October 2024)
To understand this simply: The Buffett Indicator measures the total value of all publicly traded companies against the entire nation's annual economic output (Gross Domestic Product, or GDP). Imagine, to buy every American company today, it would cost 2.24 years of the total U.S. economic production! This is an extraordinary valuation.
- 2000 Dot-com Bubble Peak: 147%
- 2020 Pre-COVID (before the massive liquidity injection): 194%
- Current Level: 224.3%
This figure surpasses every historical bubble peak recorded. Warren Buffett himself warned that a range of 75-90% is reasonable, while exceeding 120% is "playing with fire." We are far beyond playing with fire; we are in the heart of the inferno.
2. Shiller P/E Ratio: The 40x Valuation Horror
Current Value: 40.7 (167% above historical average of 15.21)
The Shiller P/E, or Cyclically Adjusted Price-to-Earnings (CAPE) ratio, offers a normalized view of valuations by asking: if you buy a company based on its 10-year average inflation-adjusted earnings, how many years would it take to break even? Currently, it suggests over 40 years!
- 1929 Pre-Depression: 32.6
- 2000 Dot-com Peak: 44.2 (the all-time high)
- 2007 Pre-Financial Crisis: 27.2
- Current Level: 40.7
History consistently shows that when this ratio exceeds 25, the next 20 years of market returns are typically dismal, signaling extreme overvaluation and future underperformance.
3. Tech "Magnificent Seven" Market Monopoly
Current Concentration: 35%
A handful of companies – Apple, NVIDIA, Microsoft, Amazon, Tesla, Google (Alphabet), and Meta – collectively known as the "Magnificent Seven," now control a staggering 35% of the S&P 500's total market capitalization. This means just seven companies out of 500 own over one-third of the entire index!
- 2015: Only 12%
- 2024: 35%
- Total Market Cap: ~$18 trillion (for these seven companies alone)
This level of market concentration represents the highest in 50 years, far exceeding the concentration seen during the peak of the 2000 internet bubble. Such dominance by a few large-cap tech stocks masks underlying market weakness and introduces significant systemic risk.
4. M2 Money Velocity: Economic "Blood Circulation" Failure
Current Value: 1.392
M2 velocity is a crucial metric that measures the "speed" at which money circulates through the economy. In essence, it tells us how often a unit of currency is used to buy goods and services within a given period. Lower numbers indicate that money is moving slower, suggesting weak economic vitality and a lack of robust spending and investment.
At 1.392, we are near historic lows. This indicates that despite massive money printing and unprecedented quantitative easing by central banks, the actual economic activity and velocity of money remain anemic. The newly created money isn't flowing robustly into the broader economy but rather appears to be pooling in asset markets, contributing to inflation and asset bubbles.
5. VIX Fear Index: Market Complacency
Current Value: 16.92
The VIX or "fear gauge" measures investor anxiety and expectations of future market volatility. Current levels around 16.92 indicate extreme market complacency. Investors seemingly perceive very few risks, as if the market will continue its upward trajectory indefinitely without any significant pullbacks or disruptions.
Historically, such periods of extreme optimism and low volatility often precede major market storms. A low VIX can be a contrarian indicator, suggesting that investors are unprepared for potential downturns, making the market more vulnerable to sudden shocks.
AI Boom's True Face: Beyond the Hype
While AI promises transformative changes, its current market manifestation reveals profound underlying risks stemming from extreme valuations and high industry concentration.
Extreme Valuation Cases
Individual AI-related companies are exhibiting valuation metrics completely divorced from historical norms and fundamental analysis:
- NVIDIA: Price-to-Sales (
P/S) ratio exceeding40x - Palantir: Price-to-Sales (
P/S) approaching69x
Historically, any company with a P/S ratio of 20x or higher has struggled to sustain such valuations long-term. These figures suggest that the market is pricing in decades of perfect, exponential growth, which is an inherently fragile premise.
Industry Concentration Risk
The performance of AI-related stocks in 2024 has been remarkable, yet brittle:
- NVIDIA:
+115%year-to-date - TSMC:
+55%year-to-date - However, during a minor correction in August:
- NVIDIA:
-14% - AMD:
-19% - TSMC:
-15%
- NVIDIA:
This extreme volatility reveals that AI sector valuations are highly fragile. Even minor disturbances, such as profit-taking or a slight shift in market sentiment, could trigger massive corrections, leading to significant capital destruction.
Historical Warnings: How Bubbles Burst
Understanding past market bubbles offers invaluable lessons on the mechanisms of their collapse.
1. 1929 Great Depression: The Leverage Demon
Trigger: Federal Reserve monetary tightening through interest rate hikes. Root Cause: Excessive leverage throughout the financial system.
Investors in the 1920s could buy stocks with as little as 10% down, borrowing the remaining 90% on margin. When stock prices began to fall, margin calls forced investors to sell, creating a vicious cycle of panicked selling that cascaded through the market.
Result: An 89% market decline from peak to trough, taking 23 years to recover its value.
2. 2000 Internet Bubble: Valuations Divorced from Reality
Trigger: Federal Reserve rate hikes to combat rising inflation concerns. Root Cause: Investors ignored fundamental valuation metrics and chased speculative concepts.
The late 1990s saw investors throwing money at anything with a ".com" in its name, regardless of profits, revenue, or viable business models. Traditional metrics like P/E ratios and cash flow were dismissed as "old economy" thinking. Most internet companies eventually proved unprofitable.
Result: The NASDAQ fell by 83%, and it took 16 years for the index to recover its previous peak.
3. 2008 Financial Crisis: Systemic Risk Explosion
Trigger: The collapse of Lehman Brothers and widespread mortgage-backed securities defaults. Root Cause: Catastrophic failure of financial institutions' risk management.
Banks had packaged subprime mortgages into complex financial products (MBS, CDO) and spread them throughout the global financial system. When U.S. housing prices began to decline, these products imploded, causing a domino effect across interconnected institutions.
Result: A 54% market decline, with an estimated $11 trillion in global market value lost.
How Long Can Bubbles Last? Monetary Policy is Key
The longevity of an asset bubble is often intrinsically linked to central bank policy and government fiscal action.
Conditions Required to Sustain Bubbles
For a bubble of this magnitude to continue expanding, an environment of extreme monetary and fiscal accommodation is typically required:
- Ultra-loose Monetary Policy: Sustained low or even negative interest rates that make speculative investments more attractive than traditional savings.
- Enhanced Quantitative Easing (QE): Central banks directly purchasing assets, including potentially equity ETFs, to inject liquidity and suppress yields.
- Continuous Fiscal Stimulus: Massive government deficit spending that pumps liquidity directly into the economy, often leading to asset price inflation.
- Inflation Expectation Management: Successfully convincing markets that any rising inflation is "transitory" and under control, thereby allowing accommodative policies to persist.
Policy Constraints
However, the current economic and political landscape presents significant constraints to implementing such extreme measures:
- Inflation Pressure: If sustained AI investment and economic activity drive persistent inflation, the Federal Reserve (and other central banks) would be compelled to raise interest rates, tightening monetary conditions.
- Fiscal Constraints: The U.S. national debt already exceeds
$32 trillion, severely limiting the government's capacity for further massive deficit spending without triggering a sovereign debt crisis. - Political Resistance: There is rising public discontent with asset bubbles, wealth inequality, and the perception that monetary policy disproportionately benefits the wealthy.
- International Pressure: Challenges to the U.S. dollar's hegemony and global financial stability could emerge if policies are perceived as reckless or unsustainable.
Realistic Probability Assessment
Given the current political and economic environments, implementing the extreme loose policies needed to sustain the AI bubble indefinitely is highly improbable. Particularly with ongoing inflation concerns, the Fed is unlikely to return to zero interest rate policies anytime soon, and further aggressive quantitative easing faces significant headwinds.
Where Are the Black Swans? Crash Catalysts
Bubbles rarely deflate slowly; they burst, often triggered by seemingly minor "black swan" events that expose underlying fragilities.
Most Likely Trigger Events
1. Geopolitical Shocks
- Taiwan Strait Conflict: A blockade or invasion could cripple
90%of the world's advanced chip supply, devastating the AI industry. - Middle East War Escalation: A wider conflict could drive energy prices to extreme levels, triggering global stagflation and choking economic growth.
- Intensified U.S.-China Tech War: Further restrictions on technology transfer could severely disrupt the global AI supply chain and innovation.
2. Financial System Explosions
- Major AI Company Financial Fraud Exposure: A scandal akin to Enron could shatter confidence in the sector, leading to widespread selling.
- Wall Street Banks Over-leveraged in AI Trading: An aggressive, speculative stance by major financial institutions could lead to a replay of the Lehman Brothers crisis.
- Regional Banks Collapse from AI Loan Defaults: If highly leveraged AI startups or related ventures default, it could trigger a localized banking crisis that spreads.
3. Tech Bubble Self-Destruction
- AI Technology Breakthroughs Fall Short: If the market discovers that AI's "emperor's new clothes" are less revolutionary than priced in, a sharp correction will follow.
- Regulatory Crackdown: Governments could impose stringent regulations on AI, similar to historical antitrust actions against internet giants, stifling growth.
- Energy Crisis: The immense power consumption required for AI training and data centers could trigger electricity shortages and escalating energy costs, impacting profitability.
4. Macroeconomic Reversal
- Unexpected Fed Aggressive Rate Hikes: A sudden, aggressive tightening by the Federal Reserve could recreate the "Volcker shock" of the 1980s, crashing asset markets.
- Sudden Dollar Collapse: A loss of confidence in the U.S. dollar could trigger capital flight from U.S. assets.
- Inflation Resurgence: If inflation unexpectedly accelerates, central banks would be forced into aggressive policy tightening, regardless of market consequences.
Historical Lessons: Small Events, Big Impact
History is replete with examples of seemingly minor events sparking major market corrections:
- 1929: A seemingly ordinary
UK rate hiketriggered a global chain reaction of selling. - 1987: A
program trading malfunctionin a portfolio insurance strategy was cited as a key factor in "Black Monday." - 2008: The collapse of
Bear Stearnsinitially seemed isolated but foreshadowed the much larger Lehman Brothers crisis.
Today's AI bubble is equally fragile. Any "small" event, if it triggers a loss of confidence or liquidity crunch, could become the straw that breaks the camel's back.
What Should Investors Do?
In an environment ripe with bubble risks, a prudent approach is essential for both individual and institutional investors.
For Individual Investors
- Reduce Tech Concentration: Avoid investing more than
20%of your portfolio in highly speculative AI-related stocks or concentrated tech ETFs. Diversify across sectors. - Increase Cash Allocation: Maintain a cash ratio of
15-20%or more. This provides a safety net and dry powder to seize opportunities during a potential market correction. - Diversify Geographically: Explore investment opportunities outside the U.S. market, especially in regions with more reasonable valuations or different economic cycles.
- Regular Rebalancing: Don't get intoxicated by short-term gains. Periodically rebalance your portfolio to maintain your target asset allocation, selling high and buying low.
For Institutional Investors
- Stress Testing: Model scenarios that include a
50%or more decline in the AI sector to understand and prepare for potential portfolio impact. - Hedging Protection: Utilize instruments such as put options or VIX options to hedge against downside risk in highly concentrated or volatile sectors.
- Liquidity Management: Ensure sufficient liquidity to meet potential large-scale redemptions from clients during a market downturn.
- Fundamental Return: Re-emphasize traditional valuation metrics and long-term fundamental analysis over speculative growth narratives. Focus on companies with sustainable competitive advantages and proven profitability.
Conclusion: History's Rhyme Scheme
Mark Twain famously said: "History doesn't repeat, but it rhymes." While today's AI bubble possesses unique technological drivers, its fundamental essence mirrors all historical bubbles: valuations divorced from reality, excessive capital concentration, and extreme investor optimism.
We are not predicting doomsday; we are advocating rational, disciplined investing. AI is indeed a revolutionary technology, but that groundbreaking potential does not justify any price. When the Buffett Indicator exceeds 224%, the Shiller P/E surpasses 40, and tech concentration reaches 35%, wisdom demands vigilance, not blind enthusiasm.
Remember, the most dangerous words in capital markets are "this time is different." Every bubble's investors thought so. Every single time, they were wrong. Don't become history's victim when it repeats – become the sage who learns from it.
Bubbles always burst. The only questions are when and how. Being prepared is the greatest responsibility you can take for yourself and your family's financial future.
Data Sources
- Buffett Indicator Data
- Shiller P/E Data
- Federal Reserve FRED Database
- VIX Index Data
- S&P 500 Sector Concentration Data
This article is for educational purposes only and does not constitute investment advice. Investment involves risks; readers should proceed with caution and consult a qualified financial advisor before making any investment decisions.


