
中文版
In a 2001 Fortune Magazine interview, Warren Buffett called the ratio of stock market capitalization to GDP "probably the best single measure of where valuations stand at any given moment." He suggested that 75-90% is a reasonable range, while anything over 120% indicates the market is overvalued.
In Simple Terms: This indicator divides the total stock market value by GDP. Think of it like buying a company - you need to check if the price matches its actual earning power. The same logic applies to the entire stock market: total market cap is the "price," and GDP is the nation's "earning ability."
An analogy: If someone earns $100,000 per year and their house is worth $2 million, that's a 20x price-to-income ratio. Similarly, if the stock market is worth 2x GDP (200%), it means the market's "price" is already twice the economy's actual output.
Current Data: Historic Warning Level!
According to the latest data (October 2025):
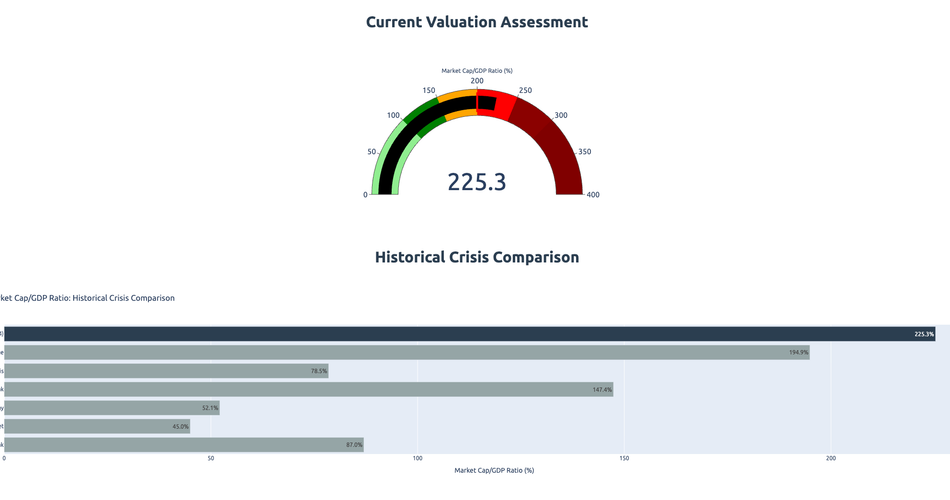
- Current Level: ~222%
- What does this mean? The stock market is worth 2.17 times the entire GDP!
- The ratio is approximately 68.63% above its historical trend (about 2.2 standard deviations)
- Market valuation is in "Severely Overvalued" territory
Historical Comparison: Beyond All Bubbles!
Let's examine the data from major historical crashes:
| Period | Buffett Indicator | Subsequent Performance |
|---|---|---|
| 1982 Major Bottom | 33-34% | Perfect buying opportunity |
| 2000 Dot-com Bubble | 136-159% | Crashed 50%+ |
| 2007 Pre-Financial Crisis | 105-137% | Crashed 57% |
| 2008 Post-Crisis | 78% | Started 10-year bull market |
| 2020 Pre-Pandemic | 195% | Brief correction then continued up |
| 2025 Current | 222% | All-time high! |
Shocking Discovery: The current 217% level far exceeds the 2000 dot-com bubble peak! This suggests the current bubble may be more severe than any in history.
Risk Analysis: Why Is This Dangerous?
Severely Detached from Fundamentals
- Normal range: 75-90%
- Overvaluation threshold: 120%
- Current: 222% (nearly 3x the normal level!)
Historical Patterns Are Strikingly Similar
- Every time the ratio exceeded 130%, a major correction followed
- 2000: Fell from 159% to 73% in 2002 (54% decline)
- 2007: Fell from 137% to 57% in 2009 (58% decline)
AI Bubble Risk
The current elevated valuations primarily reflect powerful runs in large-cap tech stocks and AI-related enthusiasm, lifting market cap much faster than GDP expands. This fragile balance could collapse instantly if earnings or growth slow down.
- GPT-5 launch underwhelmed expectations
- Summer selloff erased $1 trillion in value
- Many GenAI projects fail in practice
- AI unicorns valued at $2.7 trillion despite thin revenues
Investment Recommendations
- Extreme Caution: We're at the most dangerous level in history - any trigger could cause an avalanche.
- Diversify Risk: Don't put all eggs in one basket - consider international markets, bonds, and alternatives.
- Cash is King: Maintain ample cash reserves for buying opportunities - remember, cash is also a position.
- Focus on Fundamentals: Avoid chasing highs, look for undervalued stocks.
- Set Stop Losses: Establish strict stop-loss points for existing holdings.
Future Outlook
Based on historical valuation models, if the market returns to reasonable valuation levels over the next 8 years (historical 20-year average of ~125%), expected returns will be significantly reduced. Worse, if a correction similar to 2000 or 2008 occurs, the market could fall 40-60%.
Consider these scenarios:
- Optimistic (30% probability): Soft landing, indicator slowly returns to 150%, 30% decline
- Base Case (50% probability): Normal correction to 125%, 40-45% decline
- Pessimistic (20% probability): Hard landing below 80%, 60%+ decline
Key Takeaways
"Be fearful when others are greedy, and greedy when others are fearful." — Warren Buffett
Now is the time to be fearful. History doesn't repeat itself exactly, but it often rhymes remarkably. When everyone talks about how AI will change the world and stocks only go up, smart investors should prepare for the coming storm.
Remember: In a bubble, the last person to enter pays the highest price. Don't be that person.
Data Source: Federal Reserve Economic Data (FRED) - Stock Market Capitalization to GDP for United States
Disclaimer: This article is for reference only and does not constitute investment advice. Investment involves risk, and decisions should be made carefully.