
中文版 CHINESE VERSION
Today I want to discuss a seemingly complex but critically important economic indicator: the M2 money velocity. This metric serves as the economy's thermometer, telling us how "fast" money moves through society.
What is M2 Money Velocity?
Imagine M2 money velocity as a measure of how "busy" money is in society. Simply put, if a $100 bill is used to purchase goods 10 times in a year, its velocity is 10.
The specific calculation is: GDP (Gross Domestic Product) / M2 money supply. M2 money supply includes cash, checking accounts, savings accounts, and small-denomination time deposits. This ratio tells us how many times, on average, each dollar is used to purchase goods and services per year.
Historical Data Reveals Shocking Trends
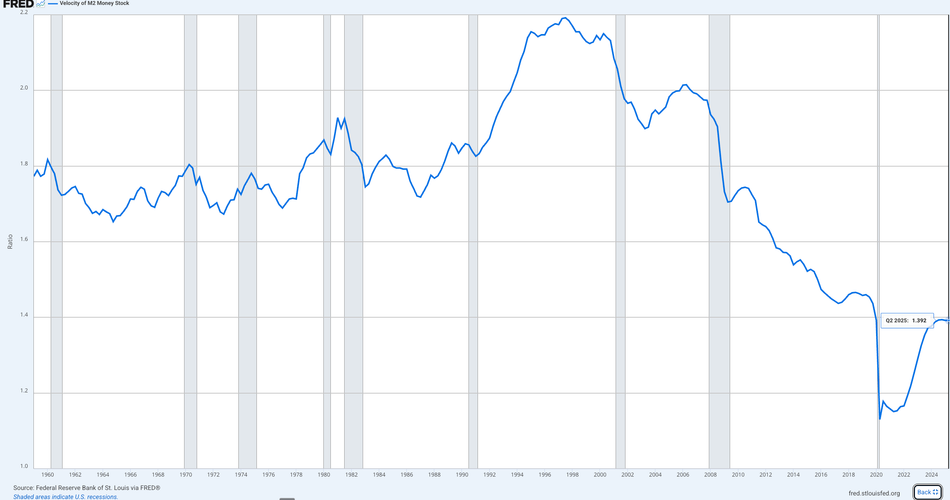
According to the latest data from the Federal Reserve Economic Database (FRED), M2 money velocity rose from 1.77 in 1959 to a historical peak of 2.19 in 1997. It then began a 25-year decline journey, reaching only 1.39 in Q2 2025.
How significant is this decline? From its peak to the present, it has fallen by a full 36%! This means that the same amount of money now has only two-thirds the "work efficiency" it once had.
Analysis of Key Time Points
The Golden Era of 1980s-1990s
Starting in 1981, M2 velocity entered a rapid ascent period, coinciding with Reaganomics and later Clinton's economic prosperity. People were confident, money circulated rapidly in markets, and economic vitality was abundant.
The 2001 Dot-com Bubble Burst
In 2001, M2 velocity quickly dropped from 2.14 in 2000 to 1.98, marking the first clear warning signal. Many people didn't realize at the time that this marked the end of an era.
The 2008 Financial Crisis Devastation
In Q4 2008, M2 velocity plummeted to 1.81, the largest single-quarter drop in 30 years. People began hoarding money instead of spending, banks became reluctant to lend, and the economy fell into a liquidity trap.
2020 COVID-19 Pandemic: Unprecedented Collapse
In Q2 2020, M2 velocity created the largest single-quarter drop in history, plummeting from 1.39 to 1.13, a 19% decline. This was even more dramatic than the 2008 financial crisis drop.
In Plain English: Why is Money Moving Slower and Slower?
1. People Increasingly Love to Save
Previously, people spent money as soon as they earned it. Now, more people choose to save it. Whether for home purchases, education, or retirement, rising savings rates directly cause declining money velocity.
2. Increased Investment Channels
Today, there are stocks, funds, wealth management products, and various investment tools. Much money gets "locked" in financial markets rather than being used to buy goods and services.
3. Economic Structural Changes
The transition from manufacturing to services, from a physical economy to a digital economy – these structural changes also affect how money circulates.
4. Side Effects of Monetary Policy
Central banks' continued low interest rate policies and quantitative easing, while increasing money supply, haven't correspondingly increased circulation velocity, potentially creating a "liquidity trap."
Comparison with Historical Crises: Where Are We Now?
Comparison with the 1929 Great Depression
Although we don't have M2 data from 1929, historical records show that money velocity during the Great Depression also experienced similar sharp declines. People hoarded cash due to panic, and economic activity nearly stopped.
Comparison with 1970s Stagflation
In the 1970s, M2 velocity maintained around 1.7-1.8, when facing high inflation and low growth stagflation. Current conditions differ; we face more issues of excess liquidity under inflationary pressure.
Comparison with Early 1980s Recession
In 1982, M2 velocity dropped to around 1.80 but quickly rebounded afterward. The key to this rebound was Chairman Volcker's aggressive interest rate hikes and Reagan's supply-side reforms.
Current Trends: Slow Recovery or New Normal?
From the 2020 low of 1.13, M2 velocity began slowly rising, reaching 1.39 by 2025. This recovery speed is somewhat faster than after the 2008 financial crisis but still far below historical levels.
Several factors deserve attention:
Positive Factors
- Consumer Confidence Recovery: As pandemic effects diminish, people are resuming normal consumption habits.
- Labor Market Improvement: Rising employment gives people more consumption confidence.
- Digital Payment Proliferation: Mobile payments and digital currencies may improve transaction efficiency.
Concerning Factors
- Population Aging: Elderly people typically have lower consumption propensity and higher savings propensity.
- Income Inequality: Wealthy people have lower marginal consumption propensity, potentially long-term suppressing velocity.
- Technology Impact: Automation and AI may change traditional economic operating models.
Implications for Investors and Policymakers
For Investors
The persistent low M2 velocity may mean:
- Traditional monetary policy effects are limited; need to focus on fiscal policy's role.
- Inflationary pressure may be more complex than it appears on the surface.
- The value of cash and liquid assets may be re-evaluated.
For Policymakers
- Simple monetary easing policies may have limited effects.
- Need to stimulate demand through fiscal policy and structural reforms.
- May need to reconsider monetary policy frameworks.
Conclusion: History Doesn't Repeat, But It Rhymes
The long-term declining trend in M2 money velocity is not accidental but reflects deep-seated economic structural changes. Although we now see some recovery signs, returning to 1990s levels may take a very long time, or may never happen.
This isn't necessarily bad. Economic development always accompanies structural changes. The key is understanding these changes and adjusting our policies and investment strategies accordingly.
As investors, we need to learn to find opportunities in this era of "slow money." As citizens, we need to understand the meaning behind these data and prepare for the future.
Data Source: Federal Reserve Economic Data (FRED) - Velocity of M2 Money Stock