
What is NFCI? Think of It as a Thermometer for Financial Markets
If financial markets were a human body, the NFCI (Chicago Fed National Financial Conditions Index) would be its thermometer. Just like a normal body temperature is 98.6°F (37°C), and anything higher signals a fever, NFCI works similarly:
- NFCI = 0: Financial markets have "normal temperature"
- NFCI > 0 (positive): Markets have a "fever" – the higher it goes, the sicker they are, indicating tightening financial conditions.
- NFCI < 0 (negative): Markets are "cool and relaxed" – money is easy to borrow, everyone's comfortable, reflecting loosening financial conditions.
Why Should You Care? Because It Can Save Your Portfolio
Imagine if you could know a storm is coming. You'd bring in the laundry, close the windows, and grab an umbrella, right? The NFCI serves as a crucial "weather forecast" for financial markets, providing early warnings that can help protect your investments.
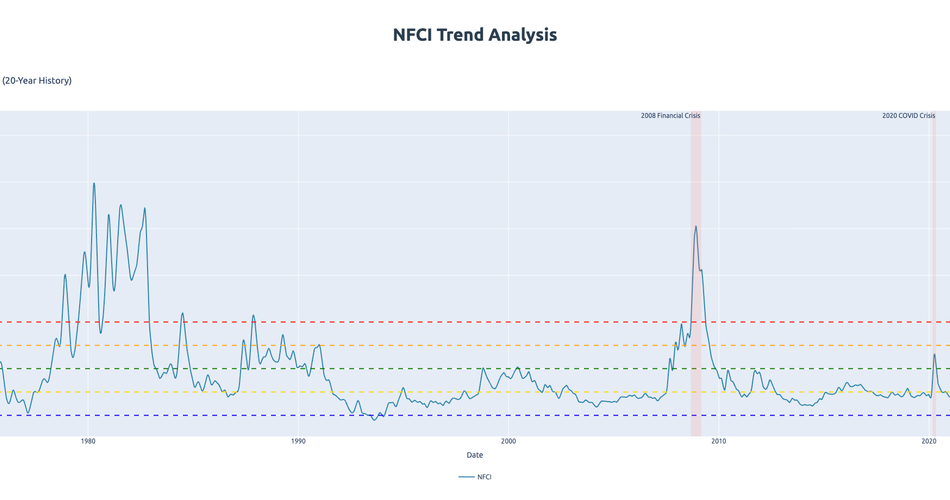
Let me show you some jaw-dropping examples of how the NFCI signaled major market shifts:
The 2008 Financial Tsunami - Lehman Brothers Collapse
This period showcased the NFCI's predictive power as financial conditions rapidly deteriorated.
- July 2007: NFCI was -0.39 (markets relaxed)
- August 2007: Suddenly jumped to +0.06 (fever starting – a critical turning point!)
- October 2008: Spiked to +2.66 (high fever)
- December 2008: Hit a terrifying +3.05 (nearly comatose, peak crisis)
Result: Stock markets halved, millions lost jobs, and housing prices crashed. If you had paid attention when NFCI turned positive in August 2007, you might have dodged this disaster.
The 2020 COVID-19 Crisis
The pandemic brought an abrupt, but ultimately brief, tightening of financial conditions.
- February 21, 2020: -0.44 (still normal)
- March 13, 2020: +0.03 (sudden fever)
- March 27, 2020: +0.28 (burning up)
Result: Market circuit breakers were triggered globally, signifying extreme stress. However, recovery was quick because central banks worldwide immediately administered powerful "medicine" – massive liquidity injections and quantitative easing – to save the markets.
The 1998 Asian Financial Crisis
While centered in Asia, the NFCI still reflected global financial anxieties.
- July 1998: -0.51 (very loose)
- October 1998: +0.01 (mild fever)
The "fever" wasn't as severe in the US, but currencies collapsed across Asia, with Thailand, South Korea, and Indonesia suffering massive losses. This demonstrates that even a slight positive shift in NFCI can be a warning of broader instability.
How to Read NFCI? Remember These Key Numbers
Understanding these thresholds is key to interpreting the NFCI's signals:
- -0.5 to -1.0: Markets are very loose. This can be a good time to invest, but don't get greedy.
- -0.5 to 0: This is the normal state. Invest normally, but remain attentive.
- 0 to +0.5: A mild fever. Start being careful, and consider reducing risky investments.
- +0.5 to +1.0: A moderate fever. This is a strong signal to sell what you can and preserve cash.
- Above +1.0: High fever! Danger! Run if you can, cash is king. Protect your capital at all costs.
What's the Situation Now (October 2025)?
The latest data shows NFCI at -0.55, which means:
- Financial markets are currently quite loose, with no immediate crisis signals.
- Banks are willing to lend, and companies can easily borrow.
- The investment environment is relatively friendly.
BUT! Remember the history lessons:
- July 2007 was also -0.39, and markets crashed a month later.
- July 1998 was -0.51, and the Asian Financial Crisis erupted two months later.
So, while things look safe now, stay vigilant. The NFCI can shift rapidly.
How Should Regular People Use This Indicator?
The NFCI isn't just for professional traders; it offers valuable guidance for everyone.
If You're an Investor:
- NFCI below -0.5: Consider increasing your stock allocation.
- NFCI between -0.5 and 0: Maintain your normal allocation.
- NFCI above 0: Start reducing positions and increase your cash ratio.
- NFCI above 0.5: Drastically reduce positions; focus on cash and bonds.
If You're an Employee:
- When NFCI keeps rising: Don't job-hop carelessly. Focus on saving emergency funds (aim for at least 6 months of expenses).
- When NFCI exceeds 0.5: Postpone major purchases (like a house or car) and wait for the crisis to pass. Job security might become precarious.
If You're an Entrepreneur:
- NFCI below 0: This is generally a good time to raise funds and expand.
- NFCI above 0: Control costs tightly, ensure robust cash flow, and prioritize survival above all else.
Why Is NFCI So Accurate?
The NFCI's accuracy stems from its comprehensive approach. It doesn't look at just one indicator but combines 105 financial metrics, including:
- Stock market volatility (is the market going crazy?)
- Credit spreads (how expensive is borrowing?)
- Bank lending willingness (are banks tightening their belts?)
- Exchange rate changes (how strong or weak is the dollar?)
- And many more, covering credit, equity, funding, and real economy risk.
Just like doctors don't only check temperature but also run blood tests and X-rays, the NFCI performs a comprehensive health check of the financial system, providing a holistic view.
Final Advice: Don't Wait for High Fever to Take Medicine
Financial crises are like the flu – if you wait until you're really sick to take medicine, it's often too late. The NFCI's value lies in its early warning capability. When it starts moving from negative territory toward zero, it's time to pay attention and adjust your strategy.
Remember Warren Buffett's famous quote:
"Be fearful when others are greedy, and greedy when others are fearful."
The NFCI helps you determine whether it's time for "others' greed" (negative NFCI) or "others' fear" (positive NFCI).
Current NFCI is -0.55, indicating markets are still loose, but watch this number closely. If it starts rising rapidly, especially approaching zero, it's time to get your umbrella ready.
Data Source: Federal Reserve Economic Data (FRED) - NFCI Update Frequency: Weekly, every Friday Current Value: -0.55 (October 17, 2025)
Disclaimer: This article is for reference only and does not constitute investment advice. Investment involves risk; make decisions carefully.