

中文版
For the first time in over three decades, we're witnessing a stunning divergence between two critical economic curves. This isn't just ordinary market volatility; it's a red alert that the financial system has developed serious underlying problems.
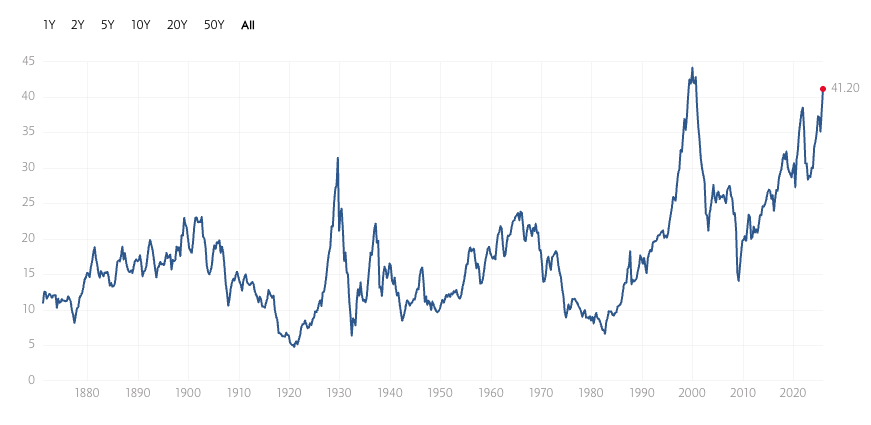
The first curve represents the Shiller PE Ratio, a measure of how "expensive" the U.S. stock market is. Currently at nearly 40x, it's alarmingly approaching the historic peak observed during the infamous 2000 dot-com bubble.
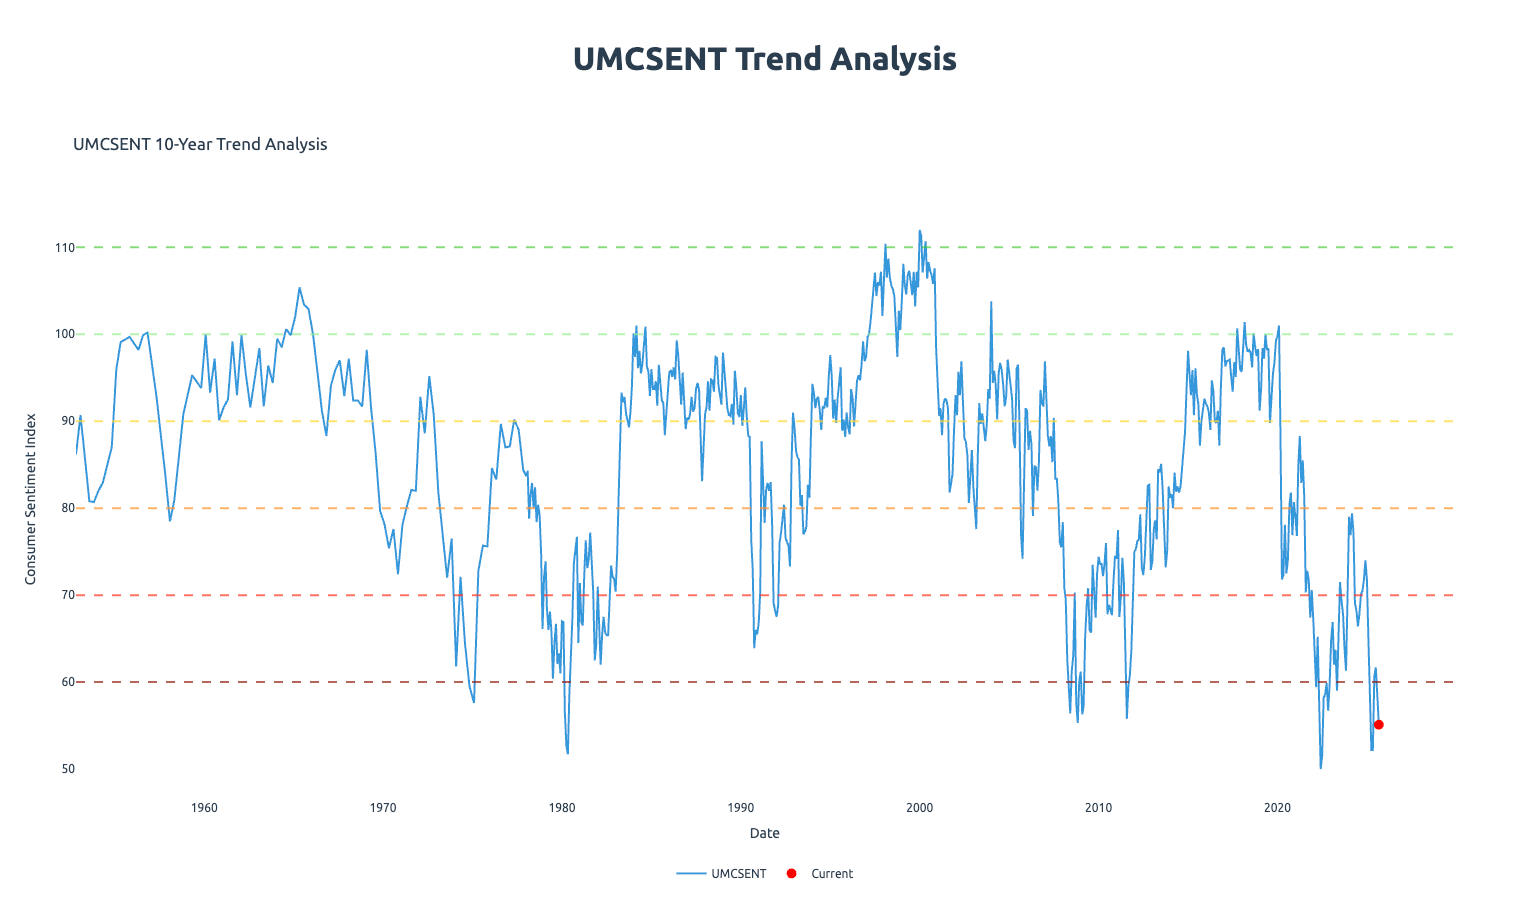
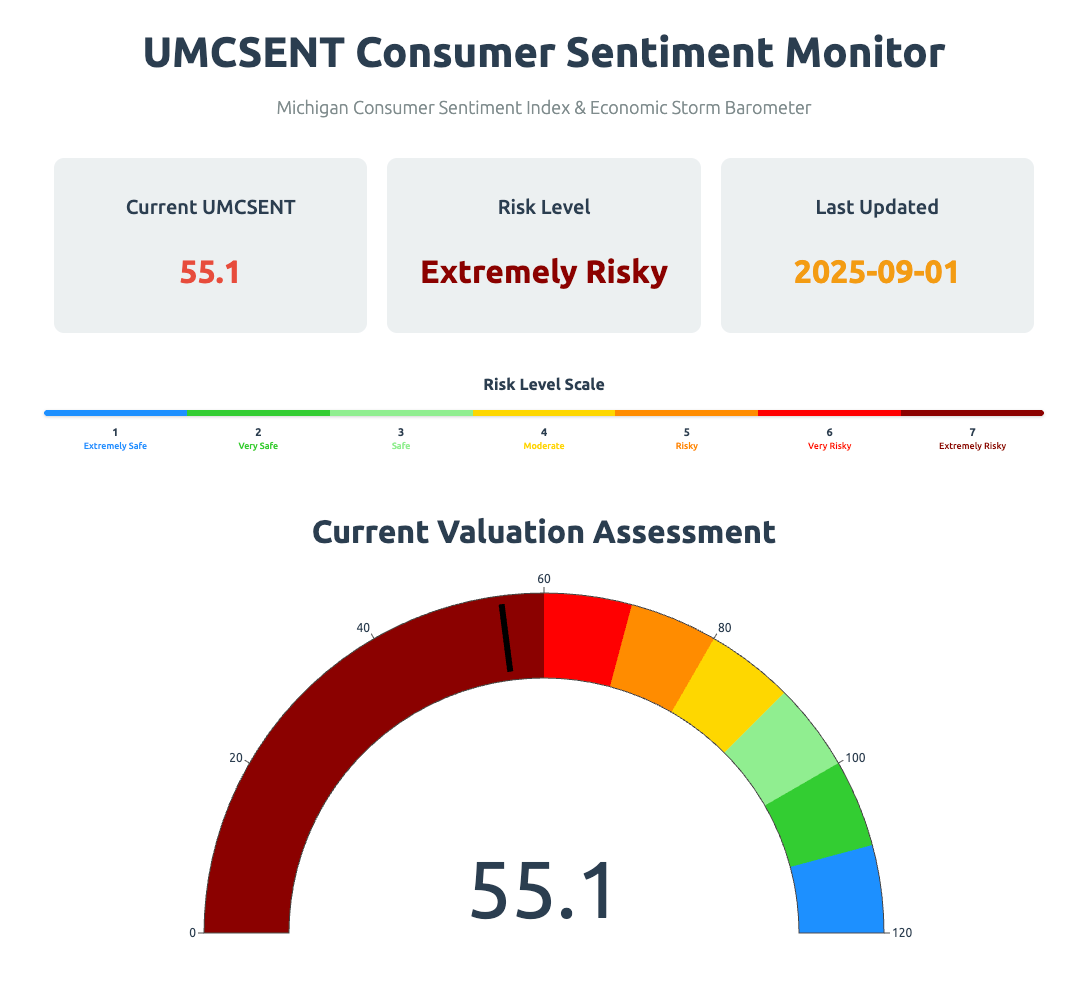
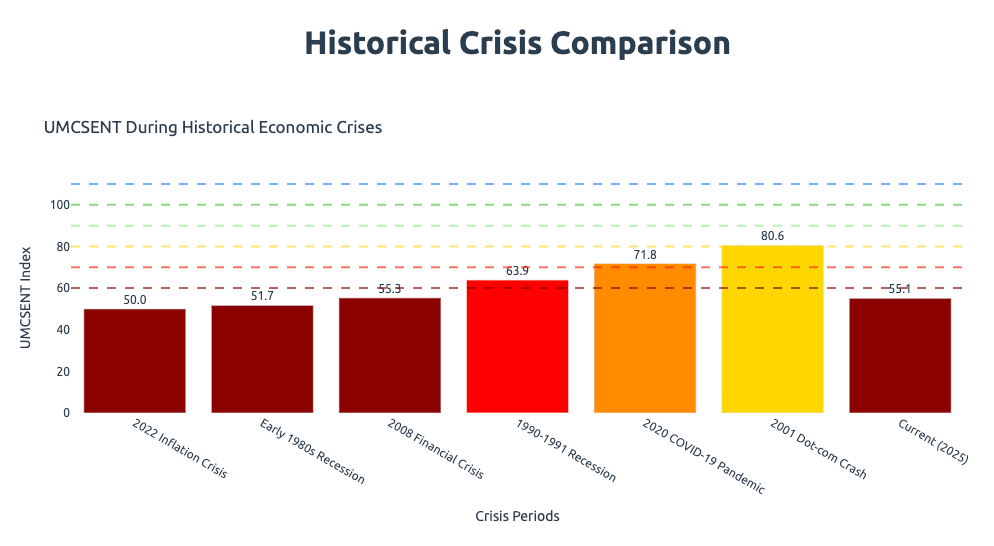
The second curve tracks the University of Michigan Consumer Sentiment Index, which recently plummeted to just 55.1 points (September 2025). This level of pessimism was last seen during the depths of the 2008 financial crisis.
What does this striking contrast signify?
On one hand, investors are extremely confident about stocks; on the other hand, ordinary people have zero confidence in their own economic situations and family finances.
This contradictory phenomenon is precisely the dangerous signal that appeared before the Great Depression of 1929, serving as a potent warning from history.
The Deep Logic Behind the Divergence
To understand this growing chasm, we must examine the forces driving both the euphoric stock market and the despairing consumer.
The Stock Market: A Capital Celebration
The latest data paints a picture of robust market performance:
- S&P 500 Index: Currently at
6,866 points, hovering near its all-time high of6,920. - Shiller PE Ratio: Approximately
40x, nearing the peak of the 2000 tech bubble. - Corporate Profit Margins: At record highs—corporations have never been this profitable.
Why is the stock market soaring to such unprecedented heights? The answer lies in the continuous growth of corporate profits. These profits, rather than flowing significantly into wage increases or broader consumption, are channeled to shareholders through dividends and stock buybacks. Shareholders, often affluent, don't typically use this newfound capital for consumption. Instead, they reinvest it into financial assets like stocks, real estate, gold, and Bitcoin, creating a powerful, self-reinforcing "money makes money" closed loop.
Consumers: The Struggle is Real
In stark contrast, the situation for ordinary people is one of increasing hardship:
- Consumer Sentiment Index: A dismal
55.1 points(September 2025), indicating extremely pessimistic sentiment. - Personal Saving Rate: A meager
4.6%(August 2025), significantly below the13%average of the 1980s. - Real Income Growth: A mere
2.2%(Q2 2025), demonstrating a continuous deceleration. - Home Price Index: The Case-Shiller Index reached
327.1(August 2025), an all-time high.
Consider this harsh reality: your annual salary grows by a modest 2%, while home prices escalate by 5-10%, and stock markets climb 20-30%. If you don't own substantial assets, you are left to watch helplessly as the wealth gap widens with each passing year.
The Broken Income Growth: The Failure of Permanent Income Hypothesis
Economist Milton Friedman's 1957 "Permanent Income Hypothesis" posits that people's consumption decisions are fundamentally based on their expectations of future income, not merely their current earnings. This theory perfectly elucidates why today's economy presents such a peculiar and unsettling state.
The Golden Age (1969-2008): Predictable Expectations
From 1969 until the 2008 financial crisis, U.S. personal income growth trends were remarkably stable and predictable. This consistency fostered confidence in people's future financial prospects, encouraging them to spend, invest, and take on mortgages, fueling economic expansion.
First Disappointment (Post-2008): Expectations Shattered
Following the 2008 subprime crisis, personal income growth fell significantly below pre-crisis trends. This marked the first time people's real income growth failed to meet their long-term expected levels, causing a profound shift in consumer psychology.
For example, individuals in the 1990s, based on prevailing trends, had certain expectations for their income levels by, say, 2020. However, the reality over the past ten-plus years is that these carefully built expectations have largely gone unfulfilled.
Second Disappointment (Post-2020): Complete Despair
After the 2020 pandemic, personal income growth plummeted once more. Current growth rates, at a mere 2.2%, are even lower than the 2008-2019 levels. People's economic expectations have been shattered not just once, but twice, leading to widespread despair.
Meanwhile, the stock market has defied these economic realities, performing far beyond anyone's expectations:
- After adjusting for inflation, personal income has grown only about
50%over the past 30 years. - During the same period, the S&P 500's real return reached
300%.
This staggering 6x gap between income growth and asset returns lies at the very heart of the problem we face today.
Plummeting Savings & Soaring Corporate Profits: The Truth About Wealth Transfer
Let's examine two critical, yet opposing, economic curves:
Curve One: Personal Saving Rate Continues to Decline
- 1980s average:
**13%** - August 2025:
**4.6%** - A brief, government-stimulus-driven rebound to
33%during the pandemic was quickly followed by a sharp and persistent decline.
Curve Two: Corporate Profit Margins Soaring Year After Year
While the personal saving rate has experienced a long-term decline, corporate profit margins have continuously climbed to new heights. This immense contrast is fundamental to understanding the mechanics of wealth transfer.
The Wealth Flow Loop:
- Corporations generate exceptionally high profits.
- These profits largely flow to shareholders through dividends and buybacks.
- Shareholders reinvest this capital into financial assets (stocks, gold, Bitcoin, real estate).
- Asset prices rise, inflating paper wealth and equity values.
- This rising asset wealth further drives up corporate valuations and future profit expectations.
The critical issue with this seemingly virtuous loop is that ordinary workers are completely excluded from its benefits, exacerbating the wealth divide.
The Housing Crisis: From Necessity to Luxury
When corporate profits and asset wealth increasingly flow into the residential real estate market, driving prices up while people's wages and savings cannot keep pace, something fundamental changes. Housing transforms from a basic human necessity into an inaccessible financial product, largely out of reach for the average citizen.
Historical Changes in Price-to-Income Ratio
- 1960-1990: The Price-to-Income ratio hovered around
**4x**, meaning an average household could afford a home with roughly four years of income. - 2025: The national average has surged to
**7x**, now requiring seven years of income to purchase a house.
Major Cities Gone Mad
The situation is even more dire in major metropolitan areas:
- Los Angeles:
12.5x(requiring 12.5 years of work to afford a home) - New York:
9.8x - Miami:
8x+
The 2025 U.S. Median Home Price: $417,000.
Families Priced Out
The consequences for families are staggering:
**74.9% of American families**cannot afford a median-priced new home.- This equates to approximately
**100 million families**effectively priced out of the homeownership market. - Every
$10,000increase in home prices eliminates an additional15,000families from homeownership. - Every
0.25%increase in mortgage rates kicks100,000more families out of the market.
The Squeeze Effect
The more money that must be allocated to housing—whether through mortgage payments or exorbitant rents—the less that can be saved. Naturally, ordinary people have little to no money left to invest in wealth-building assets like stocks, gold, or Bitcoin.
Result: Many families are trapped in a precarious financial state for life. Their essential expenses are rising relentlessly, but their ability to accumulate wealth through asset ownership simply cannot keep pace.
Frozen Social Mobility: The Death of the American Dream
The data unequivocally shows a sharp decline in what was once a defining characteristic of American society: social mobility.
Plummeting Optimism
- 2000:
75%of Americans believed they could improve their standard of living. - 2010:
50% - 2025: A dismal
**25%**—a quarter of the initial optimism.
This profound shift, from widespread optimism to deep pessimism, took a mere 25 years.
Geographic Mobility Collapse
- 1950s: An average of
20%of Americans moved annually, often in pursuit of better opportunities and upward mobility. - 2023: This figure has plummeted to a historic low of just
**7.8%**.
Moving is often a key strategy for seeking better job opportunities and improved living standards. The dramatic decline in geographic mobility directly reflects people's growing despair about improving their lives—why bother moving when the prospects are similar and equally bleak everywhere?
Wealth Inequality: Back to 1929
A powerful historical chart vividly illustrates our current predicament:
The wealth share held by the top 0.1% of Americans has returned to levels last seen in 1929.
And what followed 1929? The Great Depression.
Striking Similarities to 1929
The current economic landscape bears unsettling resemblances to the eve of the Great Depression:
- Extreme wealth inequality: Concentration of wealth at the very top.
- Frenzied stock market speculation: Unbridled optimism and risky investment behavior.
- High leverage: Margin requirements were incredibly low (
10-25%), equivalent to4-10x leverage. - Everyone trading stocks: Even anecdotal evidence suggested widespread public participation, with "shoeshine boys giving investment advice."
- Shift from consumerism to investmentism: Capital chasing capital, rather than fueling broad-based economic activity.
The 1929 Outcome
The consequences of 1929 were catastrophic. The Dow Jones Industrial Average plunged from 381 points in September 1929 to 41 points in 1932—a staggering **89% crash**. The subsequent Great Depression lasted a full decade, pushing unemployment rates to an agonizing 25%.
Lessons from History: How the Great Reset Happens
History offers a consistent lesson: every time this profound economic divergence appears, history corrects it through an "Economic Great Reset." This reset involves a fundamental rebalancing of wealth and power.
Three Potential Reset Pathways
Path One: Active Reform
- Significantly raise corporate tax rates.
- Implement comprehensive wealth redistribution policies.
- Government regains effective control and oversight over capital.
- Challenge: This path faces strong and often insurmountable resistance from powerful vested interests.
Path Two: Passive Collapse
- The market undertakes a painful, self-correction mechanism.
- This often involves severe asset price crashes, reminiscent of 1929, 2000, or 2008.
- Current Risks:
- Stock valuations remain near all-time highs, indicating significant downside potential.
- Corporate debt levels stand at a colossal
$12.3 trillion. - The global derivatives market exceeds an astronomical
$600 trillion, posing systemic risks.
Path Three: Technological Revolution
- A massive productivity leap, primarily driven by advances in AI and automation.
- Problem: Thus far, the benefits of technological progress have disproportionately flowed to capitalists, rather than being broadly shared with workers.
- Without accompanying institutional reforms, an AI revolution could ironically widen the wealth gap even further, rather than alleviating it.
Historical Case: The 1930-1950 Great Reset
The period from the 1930s to the 1950s in America serves as a powerful historical example of a complete wealth reset:
- 1929-1932: The stock market crash triggered massive wealth destruction across all sectors.
- 1933-1945: The New Deal era saw corporate taxes rise sharply, accompanied by increased government intervention.
- 1941-1945: World War II necessitated massive government mobilization and intervention in the economy, further reshaping economic structures.
- 1950s: Following the war, the American middle class experienced an unprecedented flourishing, ushering in a "golden age" of broad prosperity.
Corporate Tax Rate Changes:
- 1900s: Near
0%. - 1930s: Steadily rising to nearly
40%. - 1950-1980: Maintained at high levels, leading to a significant shrinking of wealth inequality.
- 1980s-present: Steadily dropped to historic lows, coinciding with a dramatic expansion of wealth inequality once more.
Early Warning Signals: Where Are We Now?
We are currently observing five critical danger signals appearing simultaneously, indicating the accumulation of systemic risk:
- Extreme divergence between consumer and investor confidence
- Consumer confidence:
55.1(indicating extreme pessimism) - Stock valuations: Near all-time highs (indicating extreme optimism)
- Consumer confidence:
- Persistently declining personal income growth
- Real income growth: Only
2.2% - Significantly below historical trends and expectations
- Real income growth: Only
- Housing costs severely squeeze disposable income
74.9%of families cannot afford median-priced homes- Price-to-income ratio:
7x(compared to a historical average of4x)
- Social mobility at century-low levels
- Only
7.8%of Americans are moving annually (compared to a historical average of20%) 75%of citizens now believe they cannot improve their lives
- Only
- Corporate tax rates and wealth concentration are historically synchronized
- Corporate tax rates: Lowest since the 1930s
- Wealth inequality: Highest since the 1930s
When these interconnected indicators appear concurrently, it signals that systemic risk is accumulating at a dangerous pace.
Self-Protection Strategies for Ordinary People
While the broader economic forces may seem overwhelming, individuals are not powerless. Here are actionable strategies for self-protection:
Strategy One: Recognize Signals, Stay Vigilant
Actively monitor these key economic indicators to gauge the health of the system:
Consumer Sentiment Index(University of Michigan)Shiller PE RatioPersonal Saving RateUnemployment RateCorporate Debt Levels
Strategy Two: Contrarian Asset Allocation
Learn from the masters, like Warren Buffett, who has a legendary track record of navigating market cycles:
- Buffett's Berkshire Hathaway has aggressively sold stocks over the past 18 months.
- Their cash reserves now exceed
$300 billion. - His timeless advice: "Be fearful when others are greedy, and greedy when others are fearful."
Historical Data:
- S&P 500 bear market average decline:
29%. - First year recovery average:
40%. - Key: Have "ammunition" (sufficient cash reserves) ready to buy high-quality assets when they become deeply discounted during a market downturn.
Strategy Three: Build Skills, Diversify Income
- Enhance Core Competitiveness
- In times of economic crisis, individuals with irreplaceable core skills tend to thrive.
- Focus on continuous learning and skill development to maintain market competitiveness.
- Build Multiple Income Streams
- Avoid putting all your financial eggs in one basket.
- Develop a mix of active income (salary) and passive income (investments, side businesses, royalties).
- Diversify your income beyond a single job:
Salary+Investments+Side business.
- Establish an Emergency Fund
- Aim for at least
12 monthsof living expenses saved in an easily accessible account. - This fund ensures you won't be forced to sell assets at market bottoms, even in worst-case scenarios like job loss or unforeseen expenses.
- Aim for at least
Conclusion: Crisis is When Wealth Reshuffles
History teaches us a profound truth:
After every Great Depression or major recession, wealth reshuffles.
These periods of intense economic upheaval, while painful, also create immense opportunities for those who are prepared:
- The 1930s Depression ultimately gave birth to a robust new American middle class.
- The 2000 dot-com crash created the conditions for tech giants like Google and Facebook to rise.
- The 2008 financial crisis catalyzed the emergence of transformative technologies like Bitcoin and blockchain.
Only those who are prepared can seize these opportunities and climb the social ladder after a Great Reset.
The current divergence—stock market euphoria versus consumer despair—is not an eternal state. History dictates that this imbalance will be corrected. The only questions are:
- How will it correct?
- When will it happen?
- What will be the ultimate trigger?
We cannot predict the exact timing or specific catalyst, but what we can do is focus on actionable preparation:
- Stay Vigilant: Continuously monitor key economic indicators.
- Keep Ammunition: Maintain substantial cash reserves.
- Improve Yourself: Strengthen your core competencies and acquire new skills.
- Diversify Risks: Cultivate multiple income sources and investment strategies.
Remember: Crisis is when wealth reshuffles—only the prepared can seize the opportunity.
Data Sources
- University of Michigan Consumer Sentiment Index (FRED)
- Personal Saving Rate (FRED)
- Real Disposable Personal Income (FRED)
- Case-Shiller Home Price Index (FRED)
- S&P 500 Index (Yahoo Finance)
Data as of October 2025. All analysis is for reference only and does not constitute investment advice.
