

中文版
Have you noticed that eerie calm lately? That heavy feeling in the air before something massive happens? That's exactly where we are right now. Whether people realize it or not, the economy as we know it is entering the most dangerous, most unpredictable phase in modern history.
The final stage has begun.
The signs are everywhere: in the markets, in the banks, in the cost of everything around you. Yet most people are walking straight into the storm without even realizing it's already here.
History's Warning Pattern
Every major economic collapse in history started the same way: people get comfortable. They convince themselves that things can't go wrong because they've been good for so long.
- 1929: The market reached levels no one had ever seen. Everyone thought they'd figured out how to beat the system.
- Early 2000s: People said the same thing about tech stocks. Then the dot-com bubble exploded.
- 2008: People thought housing prices could never fall. Then, in the blink of an eye, they did.
And now here we are again. Except this time it's bigger and it's global.
The Shiller PE and Consumer Sentiment Double Warning
Let the data tell the story. By analyzing the Shiller PE Ratio (CAPE) and the University of Michigan Consumer Sentiment Index from 1960 to today, we can see a disturbing pattern emerge.
The Shiller PE Ratio, developed by Nobel laureate Robert Shiller, calculates price-to-earnings using the average inflation-adjusted earnings from the previous 10 years. This smooths out business cycle fluctuations and provides a clearer picture of whether stocks are cheap or expensive relative to historical norms.
Consumer Sentiment measures how optimistic ordinary people feel about the economy's future. When people are confident, they spend more. When they're worried, they pull back—and that's often the first sign of trouble ahead.
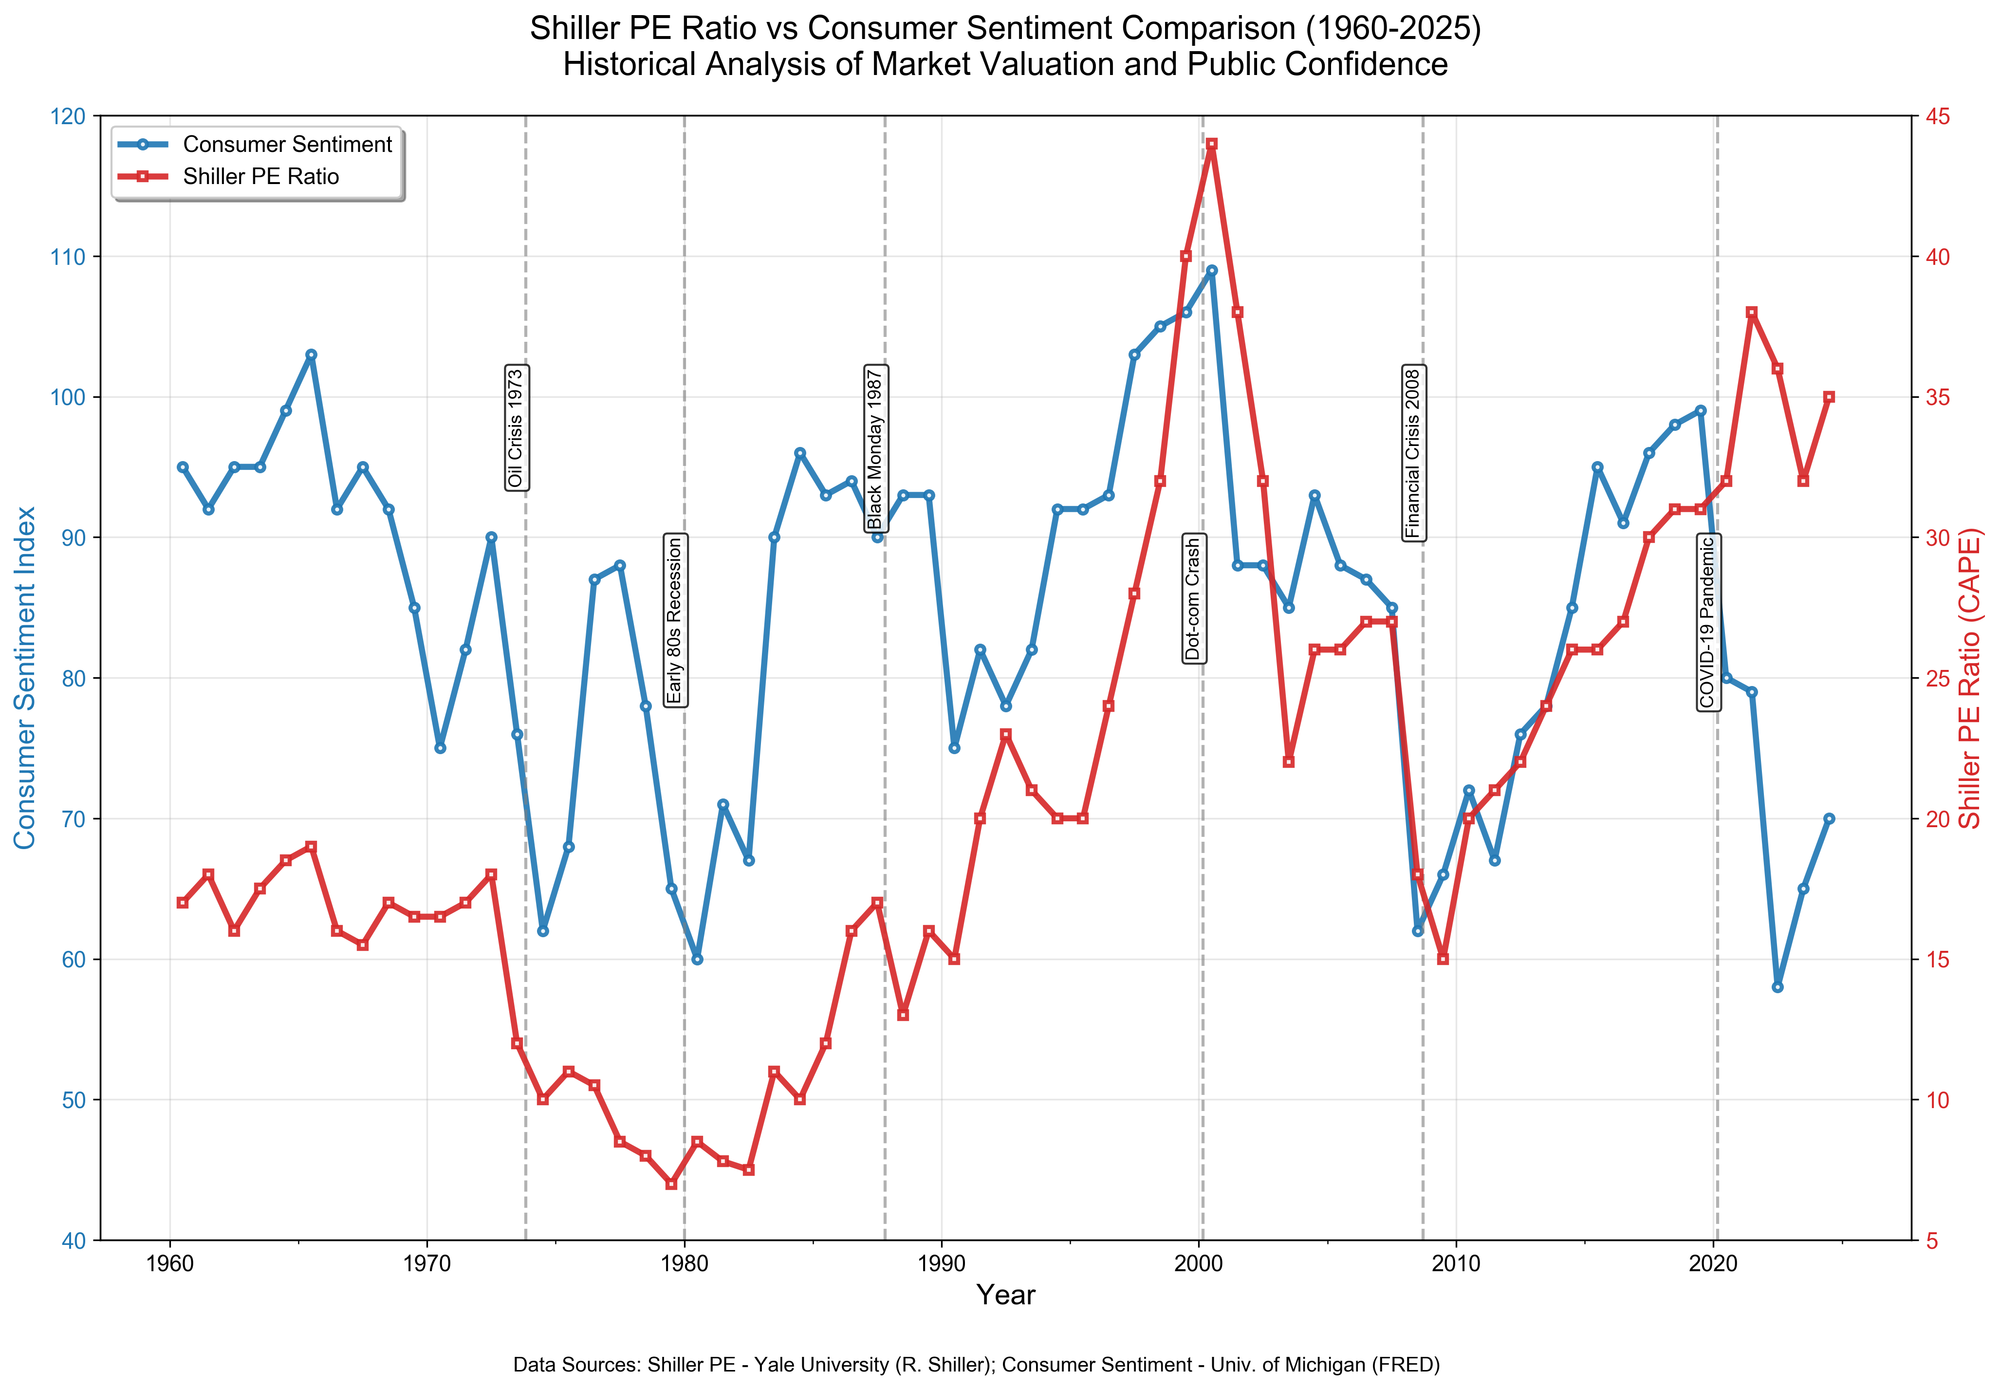
Critical Historical Moments: The Data Don't Lie
1. The 1973-1974 Oil Crisis
- Shiller PE: Dropped from 18 to 10 (a 44% decline)
- Consumer Sentiment: Plunged from 76 to 62 (a historic low)
- Result: Severe recession with soaring unemployment
2. Early 1980s Recession
- Shiller PE: Hit a historic low of 7.5
- Consumer Sentiment: Crashed below 60
- Context: The Fed raised rates to nearly
20%to combat inflation
3. The 2000 Dot-Com Bubble
- Shiller PE: Reached a historic peak of 44
- Consumer Sentiment: Hit 109 (reflecting extreme optimism)
- Result: Nasdaq crashed 78% over the next two years
4. The 2008 Financial Crisis
- Shiller PE: Fell from 27 to 18, then rebounded
- Consumer Sentiment: Collapsed from 85 to 62
- Result: The global financial system nearly collapsed
Today's Danger Signals
Look at where we are now and you'll understand why we should be worried:
Market Valuation Extremes
- Shiller PE is currently around 35, far above the historical average of 16
- This level has only been seen in
1929,2000, and2021 - Each time was followed by major corrections
Consumer Confidence Deterioration
- Consumer Sentiment has fallen to
55.1as of September 2025 - This represents a continuing decline since 2022
- Shows ordinary people are feeling increasing economic pressure
Why This Time Is Different (And More Dangerous)
The illusion of growth today is built on borrowed money. Everything you see—the markets, the houses, the cars, the new record highs—it's all fueled by debt.
- Government Debt: Borrowing at the fastest pace in history
- Corporate Leverage: Pushed to the edge
- Consumer Debt: Credit card balances hit record highs
Debt works like a drug. At first, it feels like a miracle. It makes everything faster, easier, more exciting. But the more you take, the less it works. Until one day, it stops working entirely. And all that's left is the crash.
Central Banks Have Lost Control
The scary part is that the foundation of this system—trust—is starting to crumble. Central banks are trapped:
- They can't raise rates without breaking something
- They can't cut rates without reigniting inflation
Yield curves are inverted across the board—a signal that has preceded every major recession for over 50 years.
The Real Experience of Ordinary People
While the stock market keeps rising, the reality is:
- The average person now pays more for rent, food, energy, and insurance than at any other time in modern history
- Wages haven't kept up
- Small businesses are closing
- Families are drowning in debt
They tell you inflation is 3% while your grocery bill doubles. They say unemployment is low while millions work two or three jobs just to survive.
Characteristics of the Final Stage
We've entered what I call "the final stage"—where the system tries to protect itself at all costs. You'll start to see strange things happen:
- Markets rising for no reason
- Bad news being ignored
- New narratives being pushed to keep people optimistic
You'll hear about "soft landings" and "temporary slowdowns." But make no mistake—these are the last words before the fall.
Preparing for the Storm Ahead
This doesn't mean the world ends, but it does mean the world changes. Those who understand what's happening and act early will survive it. Those who don't will be swept away.
The key now is awareness.
Because once the crash starts, it will move faster than anyone expected. Markets will drop before the news even admits what's happening. Panic will spread. The same experts who said everything's fine will tell you no one could have seen it coming.
But you'll know. You'll remember that the warning signs were everywhere, hidden in plain sight.
The Bottom Line
So ask yourself: Are you ready for the crash of the century? Because it's not about "if" anymore. It's about "when."
The system has reached its limit. The debts are unpayable, the currencies are unstable, the markets are inflated beyond reason. History is repeating itself in front of our eyes.
We're entering the final stage. The signals are flashing. The foundations are shaking. The crash isn't coming—it's already here. You just haven't felt its full force yet.
But you will. Everyone will.
Data Sources:
- Shiller PE Ratio Data - Yale University Economics Department (Professor Robert Shiller)
- Consumer Sentiment Index - University of Michigan (via FRED)
Disclaimer: This article is for educational and analytical purposes only and does not constitute investment advice. Any investment decisions should be made in consultation with qualified financial advisors. Markets carry risk, and investments require caution.