McKinsey Report: The $600 Trillion Imbalance Behind Global Wealth
McKinsey's blockbuster report reveals: Global wealth hits historic $600 trillion, but 36% of growth comes from "paper wealth" rather than real value creation. Debt-to-GDP reaches 2.6x, near all-time high. Four future scenarios: productivity acceleration, persistent inflation, secular stagnation, or

中文版
In October 2025, McKinsey Global Institute released a thought-provoking report titled "Growth That Doesn't Balance: What's Next for Wealth and Debt." This report reveals a seemingly paradoxical reality: humanity has never been wealthier, yet this wealth is built on a foundation of extreme imbalance.
As of early 2025, global net worth has reached an astonishing $600 trillion—the wealthiest moment in human history. However, beneath this prosperity lies profound imbalances that could trigger the next global financial crisis.
Core Diagnosis: Wealthy Yet Imbalanced
McKinsey's report encapsulates today's global economy with two words: wealthy and imbalanced.
What Does $600 Trillion Mean?
Global net worth of $600 trillion represents all assets owned by households, businesses, and governments worldwide minus all debts. In other words, if we viewed Earth as a super-corporation, this would be its "net worth."
More intuitively: this figure is 5.4 times global annual GDP. Historically, this ratio typically ranged between 3-4 times. This means our wealth growth rate far exceeds actual economic output growth.
Where Does Wealth Come From? Decomposing $400 Trillion Growth
From 2000 to 2024, global household wealth increased by $400 trillion. How did this happen?
- $160 trillion (40%): From real investment—newly built factories, housing, infrastructure, and other physical assets
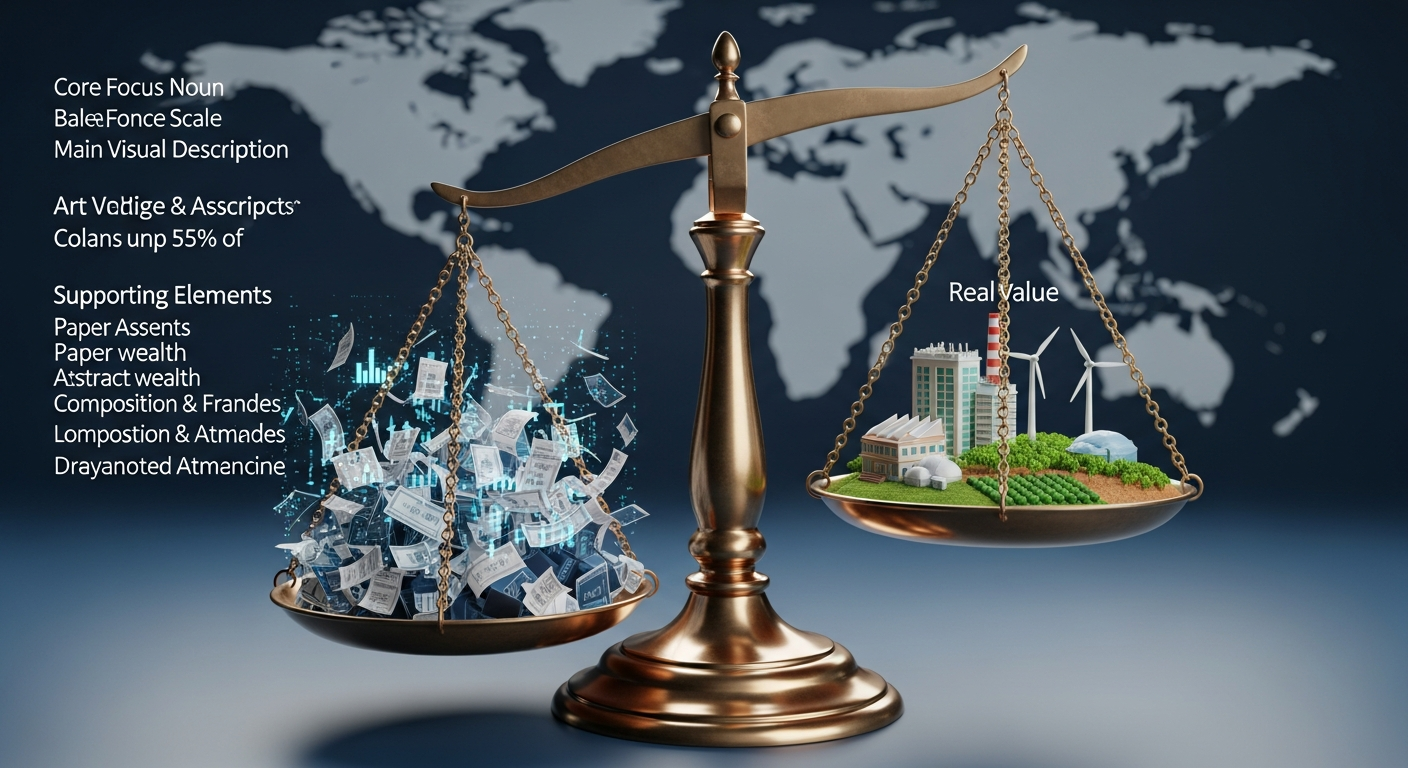
- $156 trillion (39%): From general inflation—more money in circulation raised asset prices
- $146 trillion (36%): From "excess asset price dynamics"—neither new investment nor explainable by inflation, this portion is called
paper wealthorbubble
In other words: For every $1 invested, global wealth inflates by $3.50. This massive leverage effect is like building skyscrapers on fragile foundations—the higher the building, the greater the risk.
Three Major Imbalances: Buried Time Bombs
Imbalance #1: Paper Wealth vs. Real Economy
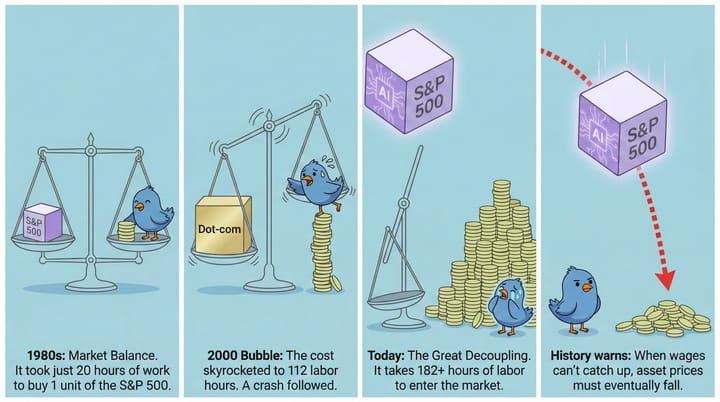
The most fundamental imbalance: our wealth growth has decoupled from our ability to create real value.
Since the turn of the century, for every $1 of new real investment globally, $2 of new debt is created. This means wealth growth largely depends on debt-driven asset inflation rather than genuine productivity improvements.
Historical Warning: This pattern has appeared multiple times in history, most notably before the 1929 Great Depression and the 2008 Financial Crisis. Each time ended with asset price collapses and deep economic recessions.
Imbalance #2: The Wealth Gap Chasm
This wealth feast driven by asset price appreciation hasn't benefited everyone equally:
- Global top 1%: Hold at least 20% of global net wealth
- US extreme case: Top 1% hold 35% of wealth; bottom 50% (160 million people) average just $900 per capita
- US-China comparison: By purchasing power parity, US bottom 50% have lower per capita wealth than China's bottom 50%
This massive wealth divide isn't just a social issue—it impacts economic health by suppressing consumer demand, intensifying social divisions, and triggering political instability.
Imbalance #3: The International Rubber Band
In the globalized system, some countries are consumers while others are producers:
- United States: World's largest net debtor, international investment position at -90% of GDP
- Germany, Japan: Long-term trade surplus, becoming America's creditors
- China: Manufacturing powerhouse, trade surplus reaching 10% of GDP, highest since 2008
This massive imbalance in international payments is like an increasingly taut rubber band, ready to snap at any moment.
Four Future Scenarios: Where Are We Heading?
McKinsey designed four possible future scenarios for the global economy, each leading to vastly different outcomes.
Scenario 1: Productivity Acceleration (Most Desirable) ✅
Core Logic: AI, green energy, and other technological revolutions fundamentally boost production efficiency. Strong GDP growth supports asset prices, reducing bubble risks.
Historical Reference: The 1990s US economic boom driven by the information technology revolution.
Wealth Impact (US example):
- By 2035, per capita wealth increases by $65,000
- Annual GDP growth rate reaches 3.2%
Scenario 2: Persistent Inflation (Painful Adjustment) ⚠️
Core Logic: Using sustained high inflation to "dilute" debt burdens. Economy appears to grow, but purchasing power continuously erodes.
Historical Reference: 1970s Western stagflation after the oil crisis—stagnant growth + high inflation.
Wealth Impact:
- Savings and fixed incomes continuously eroded
- Rising cost of living
- Retirees and low-income groups hit hardest
Scenario 3: Secular Stagnation (Boiling Frog) ⚠️⚠️
Core Logic: Long-term weak economic growth, low investment appetite, but strong savings appetite. Massive capital chases limited "safe" assets, extremely low rates, re-inflating asset bubbles.
Historical Reference: US and Europe's decade after 2008 (2010-2020); early stages of Japan's "Lost Decades."
Wealth Impact:
- Paper wealth grows but economy lacks vitality
- Bleak employment prospects
- Low resilience to external shocks
Scenario 4: Balance Sheet Recession (Most Catastrophic) ❌
Core Logic: Financial bubble bursts violently, stock market crashes, housing prices plummet. Highly leveraged households and businesses become insolvent, forced to halt consumption and investment to repay debts. Demand collapses, economy enters deep recession.
Historical References:
- 1929-1933 Great Depression: US stocks fell 89%, GDP down 30%, unemployment 25%
- 1990s Japan: Real estate and stock market bubble burst, entering "Lost Decades"
- 2008 Financial Crisis: Global stocks halved, trillions in wealth evaporated
Wealth Impact (US example):
- Per capita wealth shrinks by $95,000
- Wealth gap between best and worst scenarios: $160,000 per person
Three Major Economies: Individual Crises and Solutions
United States: Walking the Tightrope 🇺🇸
Current Diagnosis: Maintaining high investment amid risks and uncertainty
Two Major Risk Sources:
- Extreme stock market valuation: Total market cap is 3.2x GDP, far exceeding 70-year average (
1.1x) - Runaway government debt: Debt at 120% of GDP, annual fiscal deficit 7%, interest burden growing
Positive Side:
- Tech giants' R&D and capex grew 19x from 2010-2024
- Strong productivity acceleration momentum
- Healthy household sector: 85% of mortgages are 30-year fixed-rate, unaffected by rate hikes
Key Indicators:
- Can AI and new technologies sustainably convert to profit growth?
- Can government control fiscal deficits?
Prescription: Borrow less, save more, reduce fiscal deficits
Europe: Searching for Lost Competitiveness 🇪🇺
Current Diagnosis: Trapped in secular stagnation's vicious cycle
Triple Dilemma:
- Households: Falling housing prices + rising mortgage rates (mostly variable) → Savings rate surges (3 percentage points above 2010s)
- Corporations: 2022 capex and R&D investment $700 billion less than US peers; ROI 25% lower
- Productivity: Nearly flat since pandemic
Vicious Cycle: Excessive household savings → Weak consumer demand → Low corporate investment → Weak economic growth → Household pessimism → More savings
Prescription: Massive investment in defense, green energy, AI, and other strategic areas to break the stagnation cycle
China: Domestic Demand Imperative 🇨🇳
Current Diagnosis: Experiencing partial balance sheet recession, real estate cycle ending triggers chain reactions
Severe Structural Imbalance:
- Households: Savings as % of GDP surges 7 percentage points; Investment (home purchases etc.) falls 6.5 percentage points
- Government: Deficit increases significantly, playing "consumer and investor of last resort"
- Corporations: Capacity expansion but weak domestic demand → Loss-making firms reach 23% (20-year high) → Trade surplus soars to 10% of GDP
Distorted Cycle: Households save frantically → Government borrows frantically to invest → Corporations produce frantically → Export at low prices → Trade friction intensifies
Future Fork:
- If secular stagnation: Next 10 years per capita wealth gains only $500
- If successful transformation: Per capita wealth could increase $25,000 (50x the stagnation scenario!)
Prescription: Activate domestic demand, especially household consumption. Requires private consumption as % of GDP to systematically increase 6 percentage points. This needs:
- Improve social security system
- Broaden household income channels
- Continuously boost consumer confidence
Key Indicators: Where Are We Heading?
To judge future direction, closely monitor these key metrics:
United States 🇺🇸
- Fiscal discipline: Can 7% of GDP annual deficit be controlled?
- Corporate earnings: Can AI and new tech sustainably convert to profits?
- Stock valuation: Is current 3.2x GDP market cap sustainable?
Europe 🇪🇺
- Investment scale: Can the $700 billion investment gap be closed?
- Household confidence: Can savings rate return to normal?
- Reform intensity: Can structural reforms boost competitiveness?
China 🇨🇳
- Consumption share: Can it increase 6 percentage points?
- Real estate: Soft landing or hard landing?
- Corporate profitability: Can loss-making firm ratio decline?
- Trade balance: Can massive surplus moderate?
Insights for Investors and Businesses
Core Mindset Shift
The past era of low inflation, low rates, and rising asset prices—the "Great Moderation"—may be gone forever. The future will be an era of turbulence, divergence, and uncertainty.
Key Strategy: Scenario planning—prepare for all four futures
Action Guide for Different Scenarios
| Scenario | Corporate Strategy | Personal Strategy |
|---|---|---|
| Productivity Acceleration | Bold investment in new tech, talent, business model innovation | Actively allocate to growth assets, focus on tech and innovation |
| Persistent Inflation | Enhance pricing power, supply chain management, cost control | Allocate to inflation-resistant assets (real assets, equities) |
| Secular Stagnation | Focus on niches, seek structural opportunities | Balanced allocation, emphasize defense and income |
| Balance Sheet Recession | Cash is king, maintain financial health, await M&A opportunities | Reduce leverage, hold liquidity, seek crisis opportunities |
Historical Lessons: Famous Crash Comparisons
1929 Great Depression
Similarities:
- Extreme stock market valuation (1929 P/E ratio reached
32x) - Excessive debt leverage (margin trading rampant)
- Highly concentrated wealth (top 1% held 40%)
Today's Comparison:
- Current US stock valuation near historic highs
- Global debt-to-GDP at 2.6x (near historic peak)
- Similar wealth concentration (top 1% holds 20-35%)
2008 Financial Crisis
Similarities:
- Real estate bubble (subprime crisis)
- Excessive financial leverage
- Asset prices decoupled from real economy
Today's Comparison:
- China's real estate facing similar adjustment
- Higher global financialization
- Larger paper wealth share (36% vs 25% pre-2008)
1990s Japan
Similarities:
- Long-term stagnation after asset bubble burst
- Forced corporate and household deleveraging
- Chronic weak demand
Today's Comparison:
- China faces similar "balance sheet recession" risk
- Europe trapped in secular stagnation
- Weak domestic demand, excess capacity prominent
Conclusion: Certainty in an Uncertain Era
McKinsey's report paints a complete picture of the global economy: we stand at a crossroads with four vastly different paths ahead.
Certain Facts:
- Global wealth at unprecedented $600 trillion
- But this wealth built on severe imbalances
- Excessive paper wealth (36% of growth from "bubble")
- Debt levels near historic peaks
Uncertain Future:
- Can US control fiscal, avoid debt crisis?
- Can Europe break stagnation cycle, regain competitiveness?
- Can China successfully activate domestic demand, achieve transformation?
Our Choice:
The report emphasizes: we're not passive observers of the future, but active shapers. Every technological breakthrough, policy reform, and investment decision votes for the future.
"History doesn't repeat itself, but it often rhymes." — Mark Twain
1929, 2008, 1990s Japan... history repeatedly warns us: when paper wealth far exceeds the real economy, when debt leverage keeps climbing, when wealth distribution is severely imbalanced—crisis lurks nearby.
The question is: can we break the historical cycle this time and move toward a bright future of productivity acceleration?
The answer lies with global policymakers, entrepreneurs, and every investor.
Data Sources
- McKinsey Global Institute - "Growth That Doesn't Balance: What's Next for Wealth and Debt" (October 2025)
- Federal Reserve Economic Data (FRED) - Historical macroeconomic data
- World Bank - Global economic statistics
This article is based on in-depth analysis of McKinsey Global Institute's October 2025 report, combined with historical data analysis. Views expressed are for reference only and do not constitute investment advice.


