
The Unprecedented Economic Anomaly: Navigating the "Rolling Recession" of 2022-2025
Imagine a scenario where the most reliable predictor of a recession, a signal that has consistently proven accurate for nearly 70 years, flashed red for an extended period, yet the economy didn't outright collapse. What if, concurrently, the very lifeblood of our economy—the money supply—shrank for the first time since the devastating Great Depression, but unemployment didn't skyrocket? Sounds like a paradox, right? This isn't a hypothetical thought experiment; it's a concise summary of the perplexing economic landscape the United States navigated between mid-2022 and late 2025.
We are, in essence, either witnessing an unprecedented economic anomaly or our fundamental understanding of how economies operate is in desperate need of a significant overhaul. This period defied conventional classifications, challenging seasoned economists and keeping market analysts on edge. It was a time when aggressive monetary tightening collided head-on with unprecedented fiscal expansion, creating a theoretical paradox that refused to fit neatly into our traditional boom or bust narratives.
This is more than just an academic discussion. Understanding these hidden pressures is crucial because they continue to shape our financial lives, influencing everything from job security and housing costs to the fundamental stability of our banking system. The years 2022 to 2025 weren't characterized by a single, catastrophic event, but by silent, profound shifts that have left a lasting impact on everyone, often beneath the radar of mainstream news.
The Fragmented Decline: A "Rolling Recession" Unfolds
For years, warnings of a hard landing were ubiquitous. Pundits evoked specters of the 2008 financial crisis or the severe downturns of the 1970s and 80s. What actually transpired, however, was a fragmented deceleration—a phenomenon we've come to call a "rolling recession."
Imagine a row of dominoes, but instead of collapsing simultaneously in a dramatic crash, each one wobbles precariously, takes an agonizingly long time to finally topple, and often, critically, spares the next in line. This was the essence of our rolling recession.
This slow-motion correction prevented a single, massive systemic collapse. Yet, its impact was distributed unevenly, inflicting localized depressions across vast swathes of the economic landscape. Industries and regions felt acute pain, even as others showed surprising resilience.

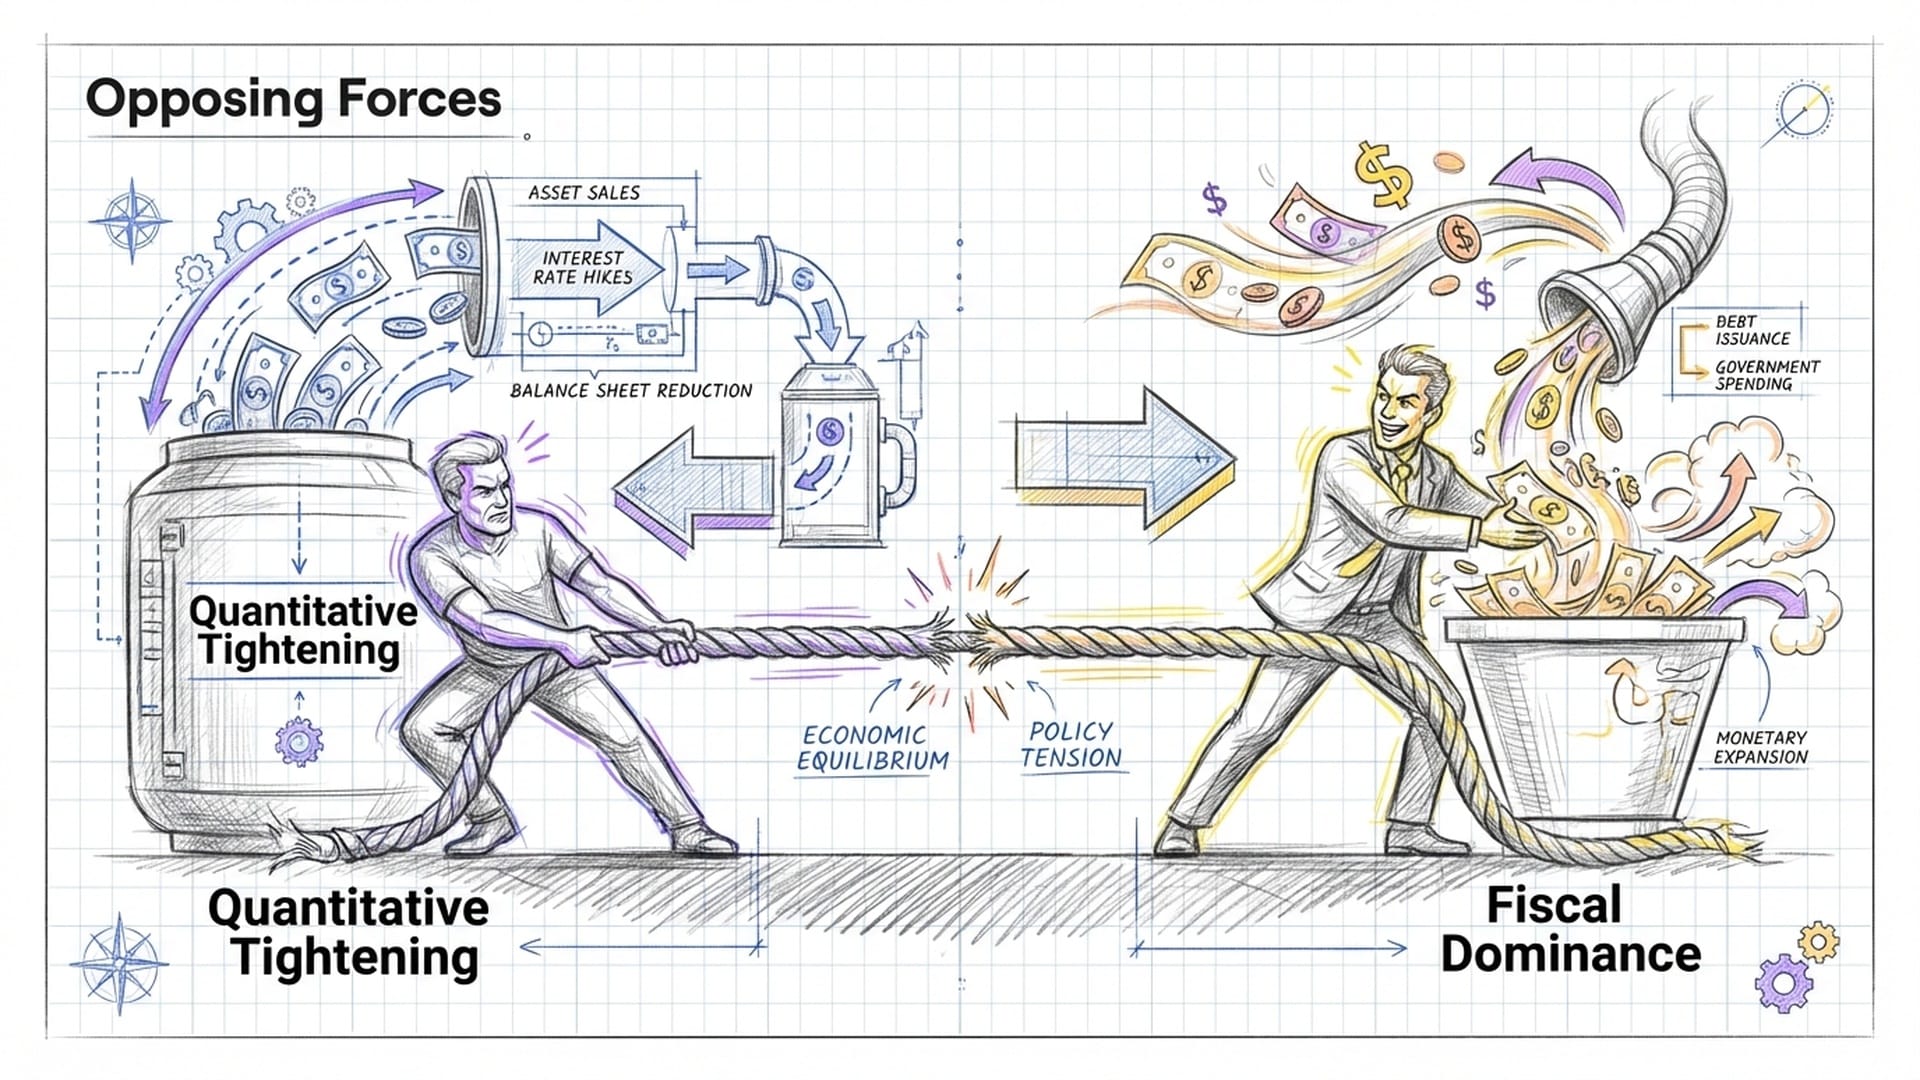
The Tug-of-War: Fiscal Dominance vs. Quantitative Tightening
To truly grasp this era, we must analyze the interplay of powerful, opposing forces. On one side stood the Federal Reserve's relentless deflationary pressure, primarily through quantitative tightening (QT). This process effectively siphoned money out of the system by not reinvesting the proceeds of maturing government bonds and mortgage-backed securities.
On the other side was the inflationary torrent of "fiscal dominance." The government continued to spend prodigiously, with persistent federal deficits averaging nearly six percent of GDP. This wasn't merely stimulus; it was a counter-force so immense that it significantly offset the Fed's efforts to cool the economy.
This dynamic created a unique tension: monetary policy pulling one way, fiscal policy pushing another, resulting in an economic environment unlike any seen in decades.
Our analysis, drawing from detailed data from the Federal Reserve and the Bureau of Economic Analysis, aims to construct a definitive account of this bizarre economic cycle. It details how the US navigated:
- The end of the "free money" era.
- The bursting of pandemic-induced asset bubbles.
- The emergence of structural headwinds in crucial sectors like commercial real estate and labor markets.
Ultimately, the US economy experienced what can be best described as a "growth-recession." This term refers to a period characterized by high nominal activity but a deteriorating underlying health—much like a marathon runner who appears strong on the surface but is secretly battling multiple injuries.
M2 Contraction: A Historical Siren Call Ignored
Let's delve into one of the most alarming signals for economists during this period: the behavior of the US money supply, specifically M2. This broad measure of liquidity, encompassing cash, checking accounts, savings accounts, and money market funds, experienced a sustained and significant contraction.
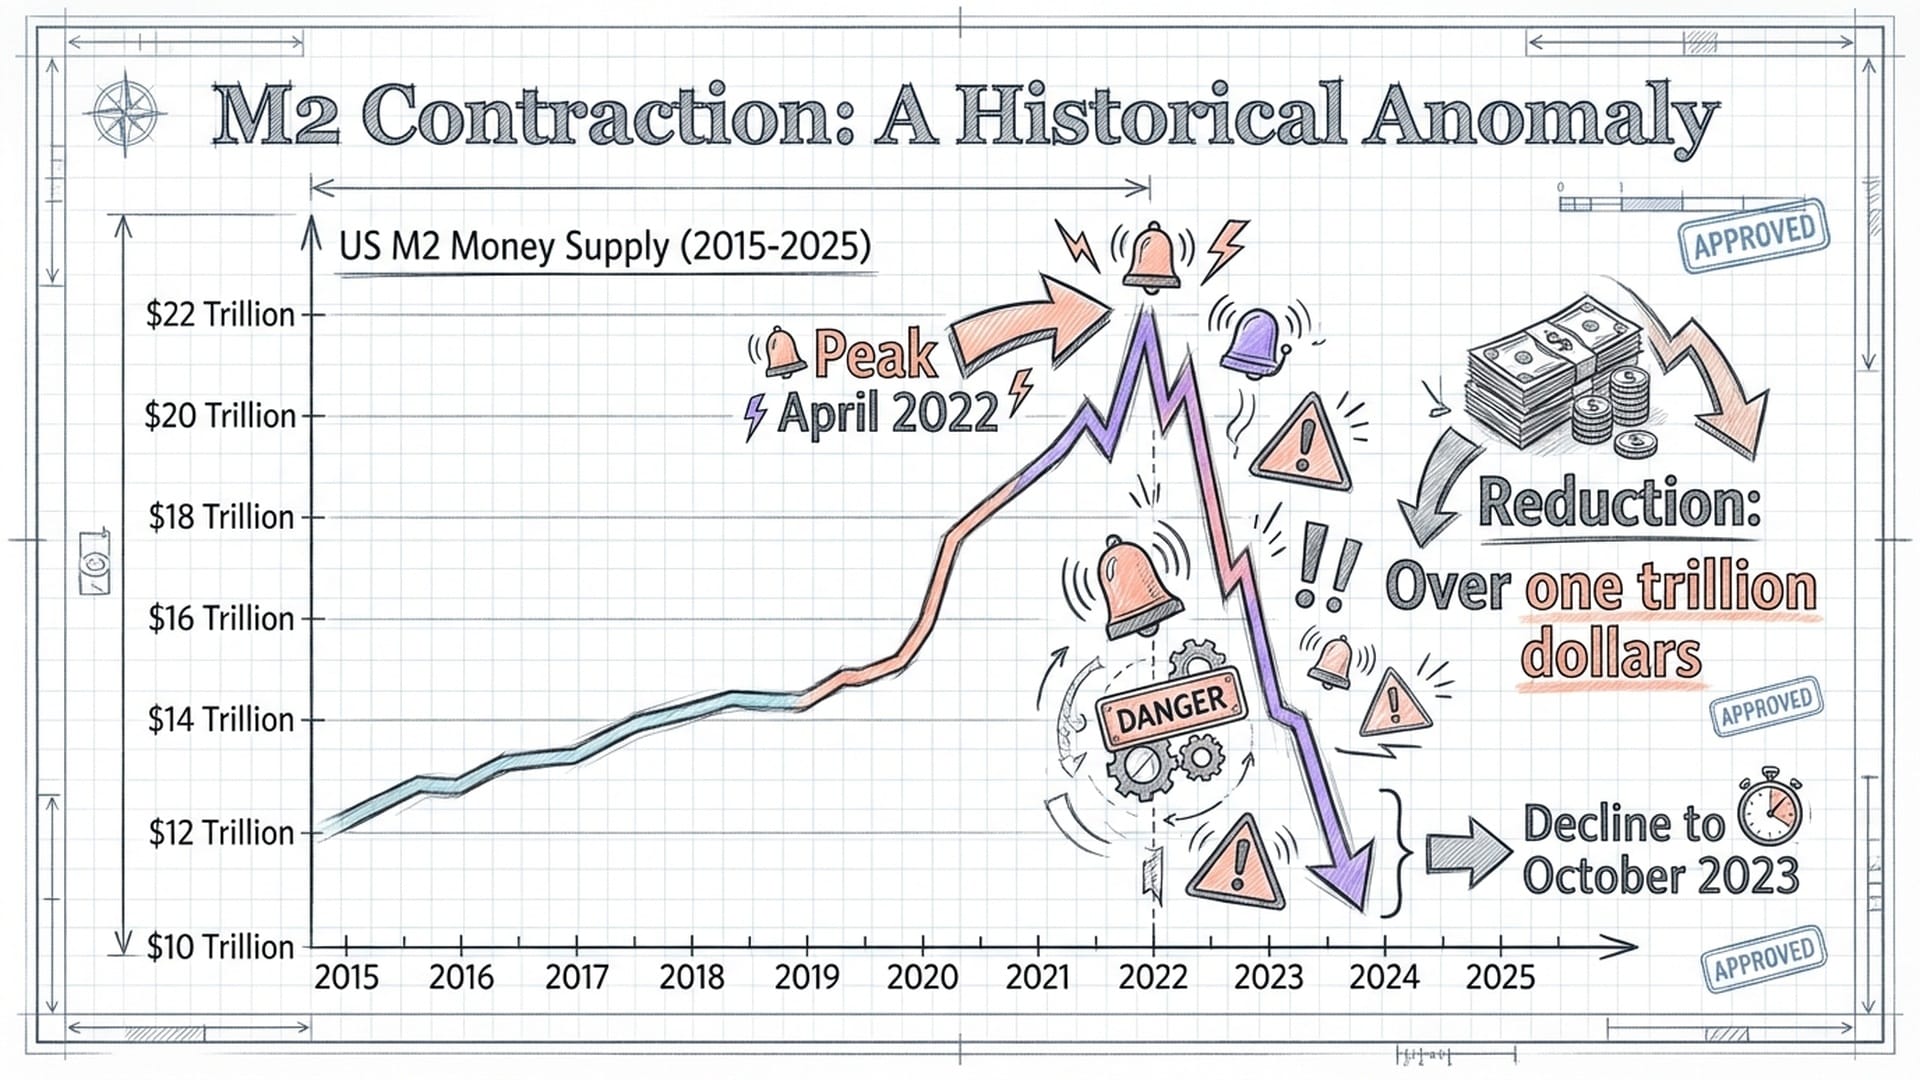
This was a dramatic reversal of decades of monetary policy. For the first time since the Great Depression of the 1930s, households actually had less money in their accounts. This phenomenon reignited a century-old debate:
- Does money supply predict everything?
- Is deflation inevitable?
- Is another depression on the horizon?
Between its peak in April 2022 and October 2023, the M2 money supply shrank by approximately 4.76 percent, a reduction of over one trillion dollars in nominal terms. By mid-2024, the aggregate decline stood at roughly 3.21 percent from its all-time high, settling around 21.025 trillion dollars. This was no mere statistical fluctuation; it was a fundamental shift.
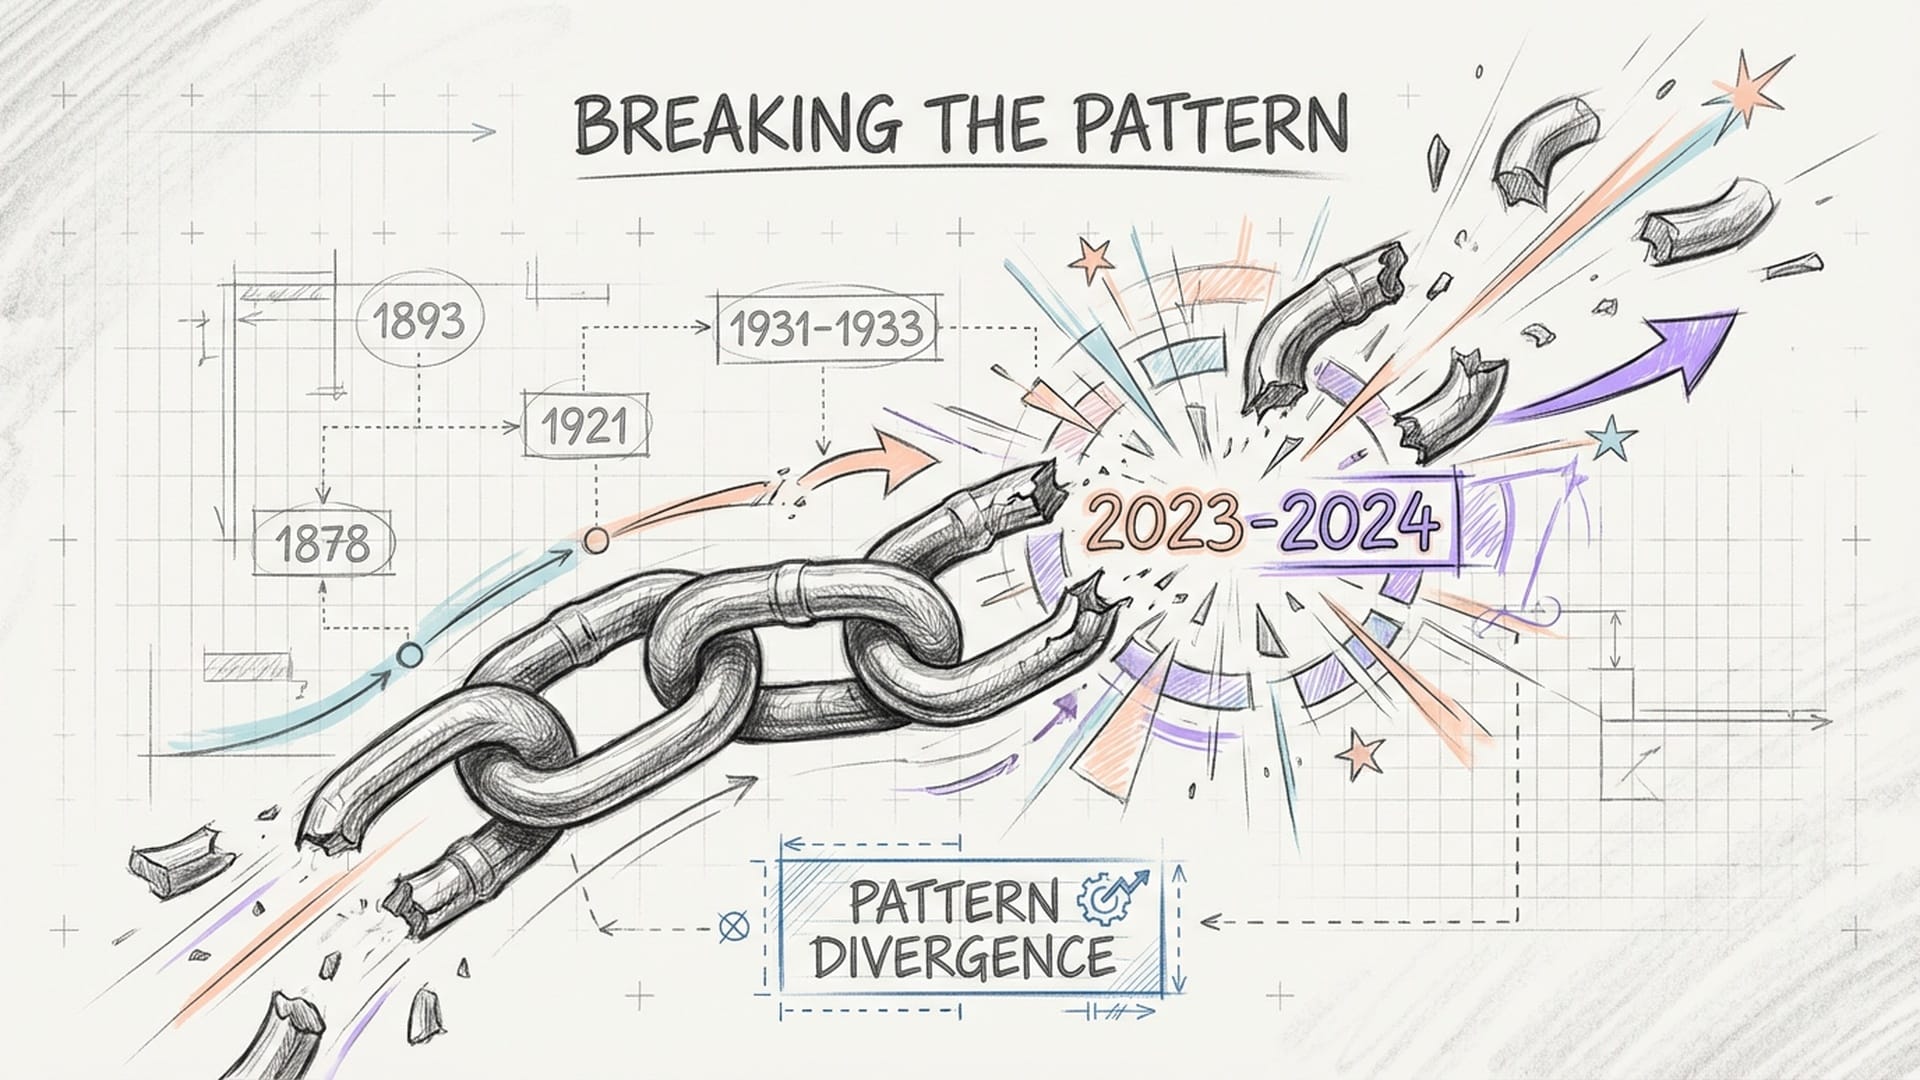
The historical context makes this even more striking. M2 has historically shown a strong correlation with economic growth, expanding due to credit and population increases. A decline of this magnitude is exceptionally rare. In the last 155 years of US economic history, year-over-year declines in M2 of at least two percent have occurred only five times:
- 1878
- 1893
- 1921
- 1931-1933
- And then… the recent 2023-2024 period.
In every previous instance, this monetary contraction foreshadowed a depression or severe panic, often accompanied by double-digit unemployment rates. This time, however, was different.
Breaking the Mold: Why This Time Was Different
The mechanism behind the 2022–2024 M2 contraction diverged significantly from historical precedents. The 1930s collapse was a solvency crisis, driven by widespread bank failures and the destruction of deposits. The recent contraction, in contrast, was an engineered policy outcome.
This was not a banking system teetering on the brink, but a deliberate effort to manage inflation and rebalance the economy.
The Federal Reserve primarily orchestrated this through:
- Quantitative Tightening (QT): The Fed ceased reinvesting the proceeds of maturing government bonds and mortgage-backed securities, effectively removing liquidity from the financial system.
- Rapid Rise in Interest Rates: Higher rates encouraged depositors to move funds from low-yielding bank accounts to higher-yielding investment options, further sterilizing a portion of the money stock.
Despite the terrifying historical correlation between M2 collapse and economic depression, the 2023–2025 cycle broke the pattern. The US economy did not descend into a deflationary depression with mass unemployment. Understanding this requires acknowledging the unique starting conditions.
The 2022 peak in M2 wasn't a "normal" cyclical high. It was the summit of an unprecedented mountain of liquidity created during the Covid-19 pandemic. In 2020 and 2021 alone, M2 surged by over 26 percent, an injection of stimulus fueled by:
- Fiscal transfers: Think stimulus checks and PPP loans.
- Monetary accommodation: Including near-zero interest rates and quantitative easing.
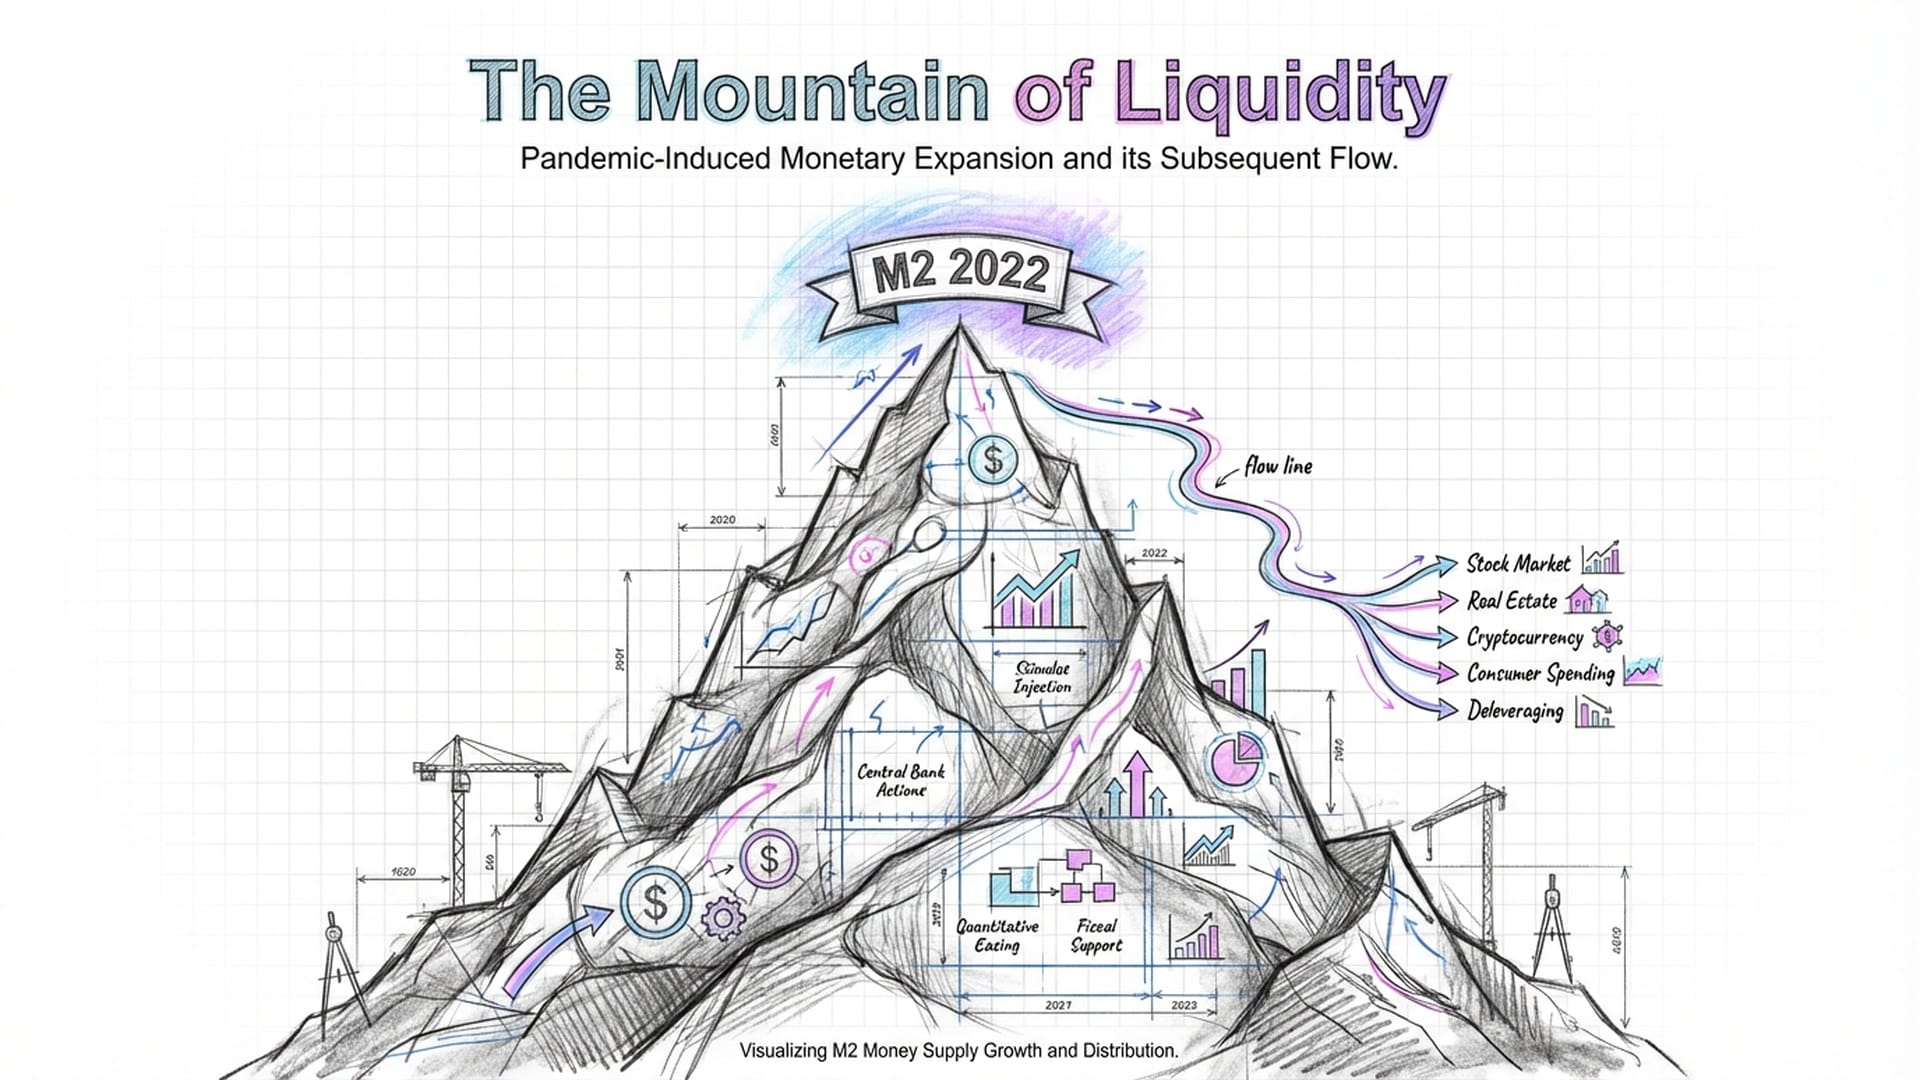
Consequently, the subsequent contraction of approximately 4.7 percent didn't cut into the "muscle" of the transactional economy. Instead, it primarily drained the "froth"—the excess liquidity that had accumulated in savings accounts and investment portfolios. Even after the decline, M2 levels in 2025 remained trillions of dollars above the pre-pandemic trend line.
This meant that while a significant amount of money left the system, ample liquidity remained for day-to-day transactions. Furthermore, the velocity of money—how frequently a unit of currency is used for transactions—remained historically low.
In a typical high-velocity environment, a reduction in the money stock leads to an immediate and sharp drop in economic activity. However, in the post-pandemic landscape, the slow speed of money allowed the reduction in supply to be absorbed by idle balances rather than forcing a sharp decrease in spending.
The "money multiplier" effect, where banks lend out every available dollar, was in hibernation. Therefore, the reduction in reserves did not trigger a cascading credit crunch for the broader economy, although it did stress specific banking cohorts that we will explore in future discussions. The economy bent, but it did not break, rewriting the textbook on monetary contractions in the process.