中文版
Imagine the financial market as a human body. The St. Louis Fed Financial Stress Index (STLFSI4) functions as its blood pressure monitor. Just as high blood pressure indicates stress and potential health issues, a high index value signals that the market is under pressure and problems might be brewing. Conversely, a normal or low reading suggests the market is healthy and functioning smoothly.
This robust index synthesizes 18 crucial financial market indicators into a single, digestible number. These indicators encompass a wide range, including interest rates, stock market volatility, and credit market conditions. It’s like a complex recipe, blending various ingredients to produce a simple output that tells us whether the financial market is "stressed" or "relaxed."
How to Read This Index?
To effectively interpret the STLFSI4, keep these three key numbers in mind:
- 0 points: This serves as the "normal line," akin to a body temperature of 98.6°F (37°C), signifying typical market conditions.
- Negative numbers (e.g., -0.5): When the index dips into negative territory, it suggests markets are relaxed. Participants are calm, borrowing money is easy, and business conditions are generally favorable.
- Positive numbers (e.g., +2.0): A positive index indicates stressed markets! The higher the number, the greater the pressure, signaling that trouble might be on the horizon.
Historical "High Blood Pressure" Moments
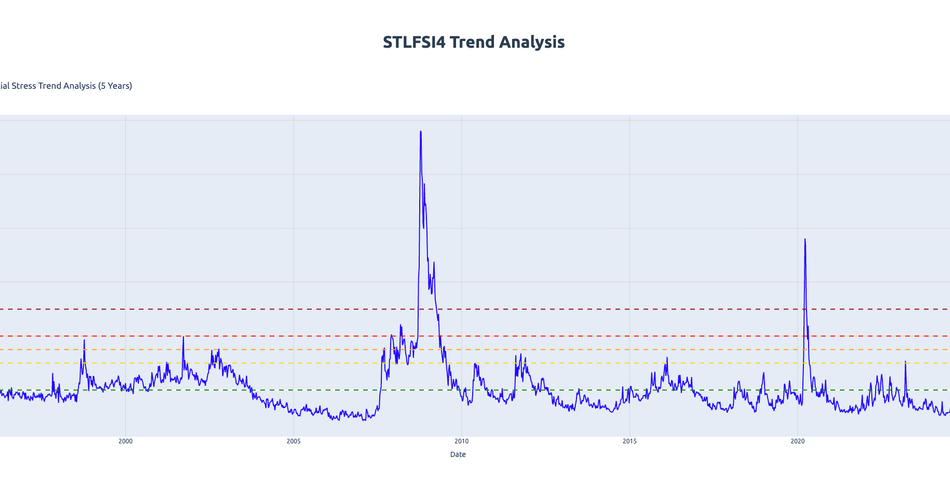
Let's examine several significant historical periods when financial markets experienced their "blood pressure explode," reflected by spikes in the STLFSI4.
1. 1998 Asian Financial Crisis (Peak: 1.87)
During the 1998 Asian Financial Crisis, currencies across Asia collapsed like dominoes. This period also saw the near-failure of Long-Term Capital Management (LTCM), a prominent hedge fund, which almost triggered a global financial meltdown. The stress index surged from negative values to 1.87, an increase comparable to blood pressure suddenly rising from 120 to 180.
2. 2008 Global Financial Crisis (Peak: 9.61!)
The 2008 Global Financial Crisis represents one of the most terrifying moments in modern financial history. In the week following the collapse of Lehman Brothers, the STLFSI4 index skyrocketed to an astronomical 9.61. To put this in perspective, if normal blood pressure is 120/80, this was like 300/200—a level ready to "burst a blood vessel" at any moment! The global financial system teetered on the brink, necessitating coordinated rescue efforts from central banks worldwide.
3. 2020 COVID-19 Pandemic Outbreak (Peak: 5.62)
In March 2020, as the world grappled with the severe implications of the COVID-19 pandemic, markets descended into extreme panic. The stress index soared to 5.62. While not reaching the heights of 2008, it was still a dangerously elevated level. The Federal Reserve swiftly responded by cutting interest rates to zero and injecting massive amounts of liquidity into the markets to stabilize the economy.
4. 2023 Silicon Valley Bank Crisis (Peak: 1.09)
March 2023 saw the sudden collapse of Silicon Valley Bank, which sent ripples of concern through the banking sector. The STLFSI4 briefly jumped to 1.09. Although not an extremely high peak, it was sufficient to put regulators and market participants on high alert, highlighting underlying vulnerabilities.
What's the Current Situation? (October 2025)
There's good news to share! As of October 17, 2025, the STLFSI4 index stands at -0.37. This negative value indicates that financial markets are currently in a relatively relaxed and healthy state. Concurrently, the Federal Reserve has initiated a phase of interest rate cuts, with the federal funds rate declining from its peak of 5.33% to 4.22%.
What does this mean for the average person and the economy?
- Market stress is low, with no immediate signs of an impending crisis.
- The Fed is easing monetary policy, making money less expensive to borrow.
- Financing costs for both businesses and individuals are declining.
- The overall financial environment is relatively friendly, fostering economic activity.
Why Is This Index Important?
The STLFSI4 acts as a crucial "health report" for financial markets, offering several key benefits:
- Early Warning: This index often rises before major crises hit, serving as an important alarm bell for impending market turbulence.
- Timing Decisions: For investors, a very high index indicates market panic—a potential moment to "be greedy when others are fearful." Conversely, a very low index might signal excessive market optimism, urging caution.
- Policy Reference: Central banks frequently consult this index when deliberating on whether to intervene in markets or adjust their monetary policy.
How Should Investors Use This Indicator?
Here are some simple usage rules for investors to integrate the STLFSI4 into their decision-making:
- Index above 2.0: This is a high alert signal! Consider reducing risky investments and increasing holdings in cash or safe-haven assets.
- Index between 0-2: Stay cautious and closely monitor market changes for any shifts in sentiment or conditions.
- Index below 0: Markets are relatively safe, but be wary of excessive optimism which can lead to complacency.
- Sudden sharp increases: Even if the absolute value isn't exceedingly high, rapid rises in the index are always danger signals that warrant immediate attention.
Relationship with Federal Funds Rate
An interesting pattern emerges when observing the relationship between the stress index and the Federal Funds Rate. Historically, when the stress index spikes, the Federal Reserve typically responds by cutting rates to "lower the blood pressure" of the financial system:
- 2008 Crisis: The Fed slashed rates from 5.25% to near 0%.
- 2020 Pandemic: Rates fell sharply from 1.55% to 0.05%.
- 2024-2025: Although current stress isn't high, the Fed has begun preventive rate cuts, demonstrating proactive policy.
This behavior is much like a doctor prescribing blood pressure medication upon detecting high blood pressure in a patient.
Summary: Are We Safe Now?
According to the latest data, financial markets are currently in a relatively healthy condition. The negative stress index indicates normal market functioning, with no signs of an imminent systemic crisis. However, it's crucial to remember that financial markets can change in an instant, so staying vigilant is always necessary.
Add the STLFSI4 to your "market health check" list and regularly monitor its changes. When you observe this index beginning to rise rapidly, it's time to be alert—history consistently shows that before financial storms arrive, this "blood pressure monitor" is often the first to sound the alarm.
Data Sources
- Data Source: Federal Reserve Bank of St. Louis FRED Database - STLFSI4
- Federal Funds Rate Data: Federal Reserve Bank of St. Louis FRED Database - FEDFUNDS