
中文版 CHINESE VERSION
The VIX Index, commonly known as the "Fear Index," is a crucial market indicator developed by the Chicago Board Options Exchange (CBOE). Simply put, it's like the stock market's "thermometer" that measures how scared investors are.
Imagine if the stock market were a person – the VIX would be the device measuring how fast that person's heart is beating. The faster the heartbeat, the more nervous they are; the higher the VIX, the more panicked the market is.
How is the VIX Performing Currently?
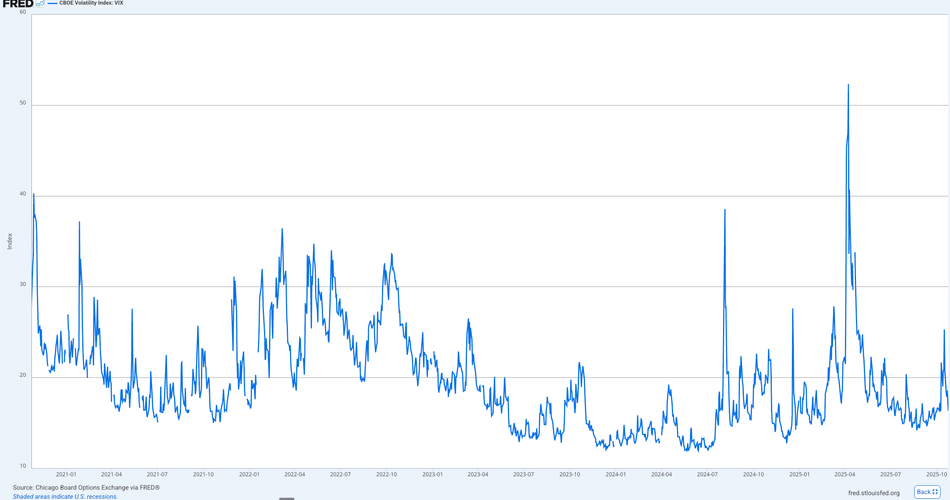
According to the latest data (as of October 24, 2025), the VIX index stands at 16.37, which is at a relatively low level. What does this mean?
Under normal circumstances:
- VIX between 15-20: Market is relatively calm, investor sentiment is stable
- VIX between 20-30: Market is somewhat tense, but still within normal fluctuation range
- VIX above 30: Market begins to panic
- VIX above 40: Extreme panic, usually accompanied by major crises
The current reading of 16.37 indicates that market sentiment is generally stable, with investors having modest expectations for stock market volatility over the next 30 days.
Historical "Panic Moments"
Let's review several historical moments when the VIX index "exploded" to see what real panic looks like:
2008 Financial Crisis: The Most Panicked Moment in History
On November 20, 2008, the VIX reached its historical peak of 80.86! What does this mean?
Imagine if a normal person's heart rate is 70 beats per minute – a VIX of 80.86 would be like their heart beating 200 times per minute. The entire market was having a "heart attack."
VIX trends during that period:
- September 2008: Before Lehman Brothers collapsed, VIX was still between
20-30 - October 2008: VIX skyrocketed to
60-80, market in extreme panic - December 2008: VIX remained between
40-70, showing panic sentiment lasted for several months
2020 COVID-19 Panic: Fast but Brief Impact
In March 2020, when the COVID-19 pandemic broke out, VIX peaked at 82.69, almost matching the 2008 record. Interestingly, this panic came fast and left fast:
- February 2020: VIX was still in the normal
15-20range - March 2020: VIX surged to
80+ - June 2020: VIX had already fallen back to around
30
This shows that while the market's reaction to the pandemic was severe, the adaptation speed was very fast.
What Investment Wisdom Does VIX Tell Us?
Panic Often Creates Buying Opportunities
Warren Buffett famously said:
"Be greedy when others are fearful."
Historical data shows that when VIX exceeds 40, it's often a good time for long-term investment. After VIX peaked in both 2008 and 2020, the stock market experienced strong rebounds.
Be Cautious When VIX is Low
When VIX stays below 15 for extended periods, it may indicate the market is overly optimistic and investors lack risk awareness. This "boiling frog" state often signals an upcoming correction.
VIX is Not a Prediction Tool, But an Emotion Thermometer
VIX can only tell us how scared the market currently is, but cannot predict whether stocks will rise or fall tomorrow. It's more like a "rearview mirror," reflecting how events that have already occurred affect market sentiment.
How Can Ordinary Investors Use VIX?
Asset Allocation Reference
- VIX < 20: Can appropriately increase stock investment proportion
- VIX 20-30: Maintain balanced allocation
- VIX > 30: Consider increasing cash or bond proportion
- VIX > 40: Panic moments may actually present opportunities for gradual buying
Emotional Management Tool
When you feel the market is scary, check the VIX data. If VIX is only in the 20s, you might be overly nervous; if VIX exceeds 40, your concerns are justified, but remember that such panic usually doesn't last long.
Conclusion
The VIX index is like a barometer of market emotions, reminding us that:
- Market sentiment fluctuates cyclically, which is normal
- Extreme panic often means opportunity
- Stay alert during periods of excessive optimism
- Invest rationally, don't be swayed by short-term emotions
Remember, investing is a marathon, not a sprint. VIX doesn't tell us when to run faster, but when we need to adjust our pace.
Data Source: Federal Reserve Economic Data (FRED) - CBOE Volatility Index